You can display a graph showing the change in the value of any feature throughout the animation. You can manipulate the graph to change keys, cushion the animation, or add keys, as an alternative to working in the keybar.
To Display the Detail Graph
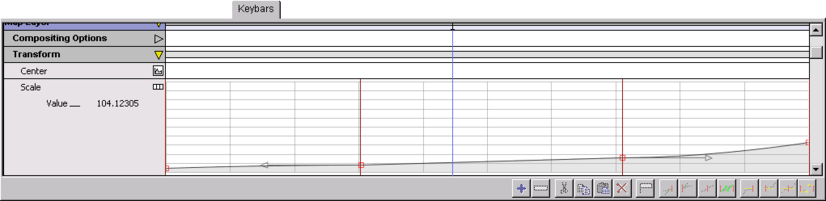
Click the Detail ( ) button to the right of the feature name. The keybar expands to show the detail graph.
To Return to Keybar View
Click the keybar ( ) button to the right of the feature name.