The Data Import plug-in enables Microsoft Excel (.xls and .xlsx) and Microsoft Access (.mdb) file import via ADO, and distributes it to a text field or a shared memory map.
Data Import supports reading both numbers and text.
To access Excel or Access data using this plug-in, you must first install the Microsoft Access Database Engine 2016 Redistributable.
Note: This plug-in is located in: Plugins -> Container plug-ins -> VisualDataTools
This page contains the following topics and procedures:
Data Import Properties
File: Chooses the required document.
Table / Sheet: Defines the name of the sheet or table.
Column(,Col...): Sets one or more column names to use (comma separated).
Area Input: Uses area information.
Column Input: Uses column information.
Row Input: Uses row information.
Data Delim.: Includes a delimiter after each row.
Column Delim.: Includes a delimiter for column separator sign(s).
Shared Mem.: Sets Scene-, Global- or Distributed-Shared Memory for data transport. Use Inactive memory to not forward any values via Shared Memory.
Key: Determines Shared Memory key name.
GetIt: Reads the document, sends the required data and shows it in the text box.
To Create a Scene with Data Import
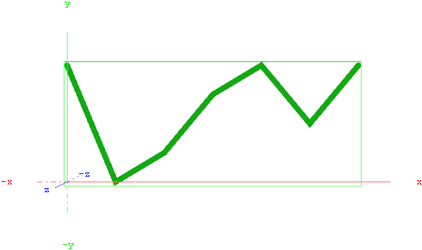
This procedure imports data from an Microsoft Excel sheet and feeds Line Chart with data through Shared Memory.
Start Microsoft Excel.
Enter ExcelDataY into cell A1.
Add some sample values in the cells below (A2-A8:
80,40,50,70,80,60,80).Rename this first sheet to MyTable (can be done with a double click on the sheet name at the bottom).
Save and close the Excel document.
IMPORTANT! You must close the document before importing it to Viz Artist.
Start Viz Artist and create a new scene.
Add a group container to the scene tree.
Add a material to the group container.
Open the Transformation Editor and set Position X to
-200.0and Position Y to-100.0.Drag and drop the Line Chart and Data Import plug-ins to the same group container.
Set Shared Mem. to Scene with MyDataY as Key name for both plug-ins.
Set Data Delim. to # for both plug-ins.
For Line Chart, set ChartWidth to
500.0.Activate DataY Fit, DataY Auto Scale and DataY Detect Limits.
Adjust DataY Stop to
200.0.Activate Const. Thickness to give the chart a constant line width.
For Data Import, set the stored Excel file as the File parameter.
Enter MyTable for the Table/Sheet parameter and ExcelDataY for Column (,Col…).
Click the GetIt button and the chart shows.


