Analyzing the performance of Viz Artist/ Viz Engine can be done with:
Performance Monitor: Closely monitors a range of parameters for analyzing real-time performance.
Performance Analyzer: Monitors key performance and camera parameters, as a head-up display in the renderer window.
Performance Tracing: Captures a detailed trace report over multiple frames.
Performance Monitor
To open the Performance monitor click on the  toolbar button.
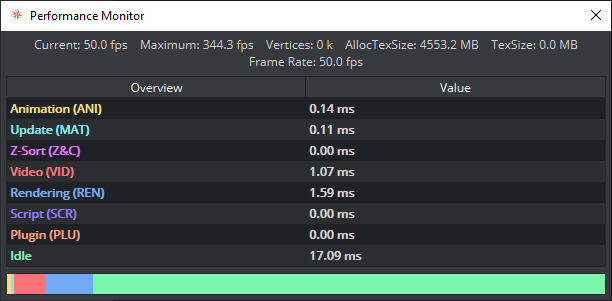
The performance bar gives an idea of the current scene rendering performance (frames per second).
Current (CUR): Shows how many frames per second the scene renders in On Air mode. The number should be above 50 (PAL) or 60 (NTSC), according to the rate that has been specified in the Output Format section of the Viz Engine Administrator Guide.
Maximum (MAX): Shows how many frames per second the scene can render at without waiting for vertical retrace. The higher the maximum value, the more performance is left. If the maximum value is reduced to below
50or60, the scene is not rendering in real-time.Vertices (VER): Shows the number of vectors in the scene.
AllocTexSize (TET): Shows the total allocated size of texture memory.
TexSize (TEC): Shows the size of the currently used texture memory.
Animation (ANI): Shows how many microseconds all active directors and animation channels take. This indicator is linked to the yellow bar.
Update (MAT): Transforms each container in the scene into world coordinate space. This indicator is linked to the cyan bar.
Z-Sort (Z&C): Refers to Z-sort and Culling, and sorts all containers for correct transparency drawing and determines if containers are visible in the current camera view. This indicator is linked to the pink bar.
Video (VID): Shows how many microseconds video input (live video texture) and video output take. De-interlaced video inputs take longer time than progressive and interlaced. The only way to improve this value is to use a faster system. This indicator is linked to the red bar.
Rendering (REN): Shows how many microseconds it takes to render all objects on the screen. A faster graphics card improves this value. This indicator is linked to the blue bar.
Script (SCR): Shows the consumed time in microseconds from all active scripts. This indicator is linked to the dark green bar.
Plugin (PLU): Indicates how much time in microseconds all active plug-ins spend in each render cycle. This indicator is linked to the orange bar.
Idle: Shows available resources in microseconds the renderer has available. This indicator is linked to the light green bar.
Renderer Overlays
To select which performance data to show in the renderer window, click on the Render Overlays tool button then select the options to show:
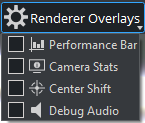
Performance Bar: Shows the a detailed Performance analyzer.
Camera Stats: Enables the head-up display (HUD) showing the following parameters in the renderer view:
Camera 1-n: Shows the currently selected camera.
Position: Shows the camera’s X, Y and Z position.
Pan/Tilt/Twist: Shows the camera’s pan, tilt and twist parameters.
FovX/FovY: Shows the camera’s field of view (FOV) for the horizontal (X) and vertical (Y) plane.
Center Shift: Shows the X and Y position of the camera’s center shift.
Center Shift: Shows the center shift marker as a cross hair in the renderer.
Debug Audio: Turns on/off a visual representation of the audio mixing.
Performance Bar (Classic)

The performance bar gives an idea of the current scene rendering performance (frames per second).
The values shown are the same as described in the Performance Monitor section above.
Performance Bar and Analyzer (Viz Engine Render Pipeline)
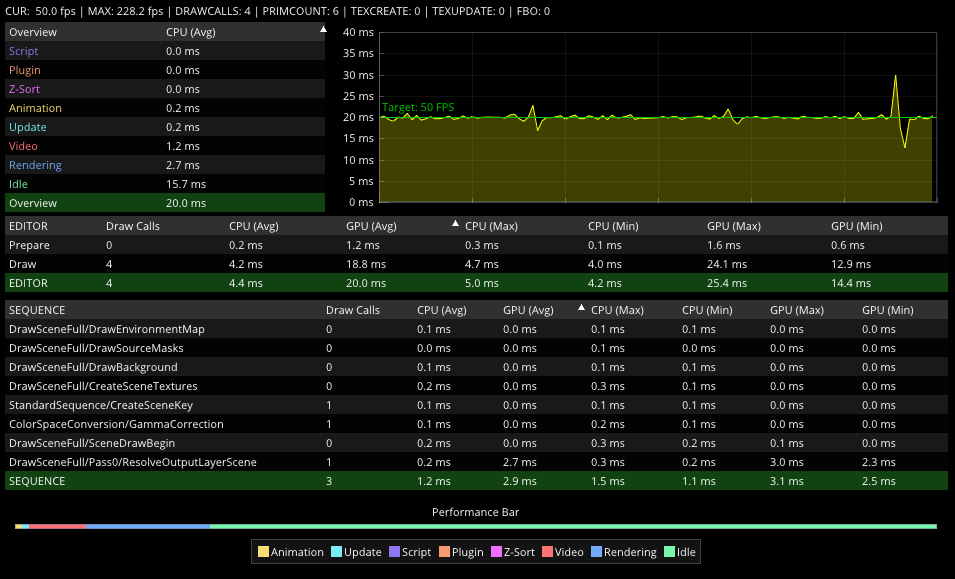
The Viz Engine Render Pipeline shows more detailed information about:
Current and Maximum Framerate.
Segmented render time and historic data.
Timing information for all used Sequence pipelines.
Performance Bar.
Performance Tracing
Performance Tracing records exactly what Viz Engine does in every frame, for example rendering, scripts, plug-ins and video. The recording is saved as a trace file (.pftrace inside C:\ProgramData\vizrt\VizEngine\trace) in the open Perfetto trace format.
If you see performance problems such as dropped frames, stutter or a low frame rate, record a trace while the problem happens and attach the file to your support ticket.
Where to Find Tracing
Record Trace toolbar button: The record button in the On Air toolbar starts and stops a recording with one click. The button turns red while recording.
Performance Monitor > Tracing tab: Open the Performance Monitor and select the Tracing tab. All tracing options are here.
Scene Settings > Performance: The same tracing options are also in the Scene Settings panel (not available in Engine mode).

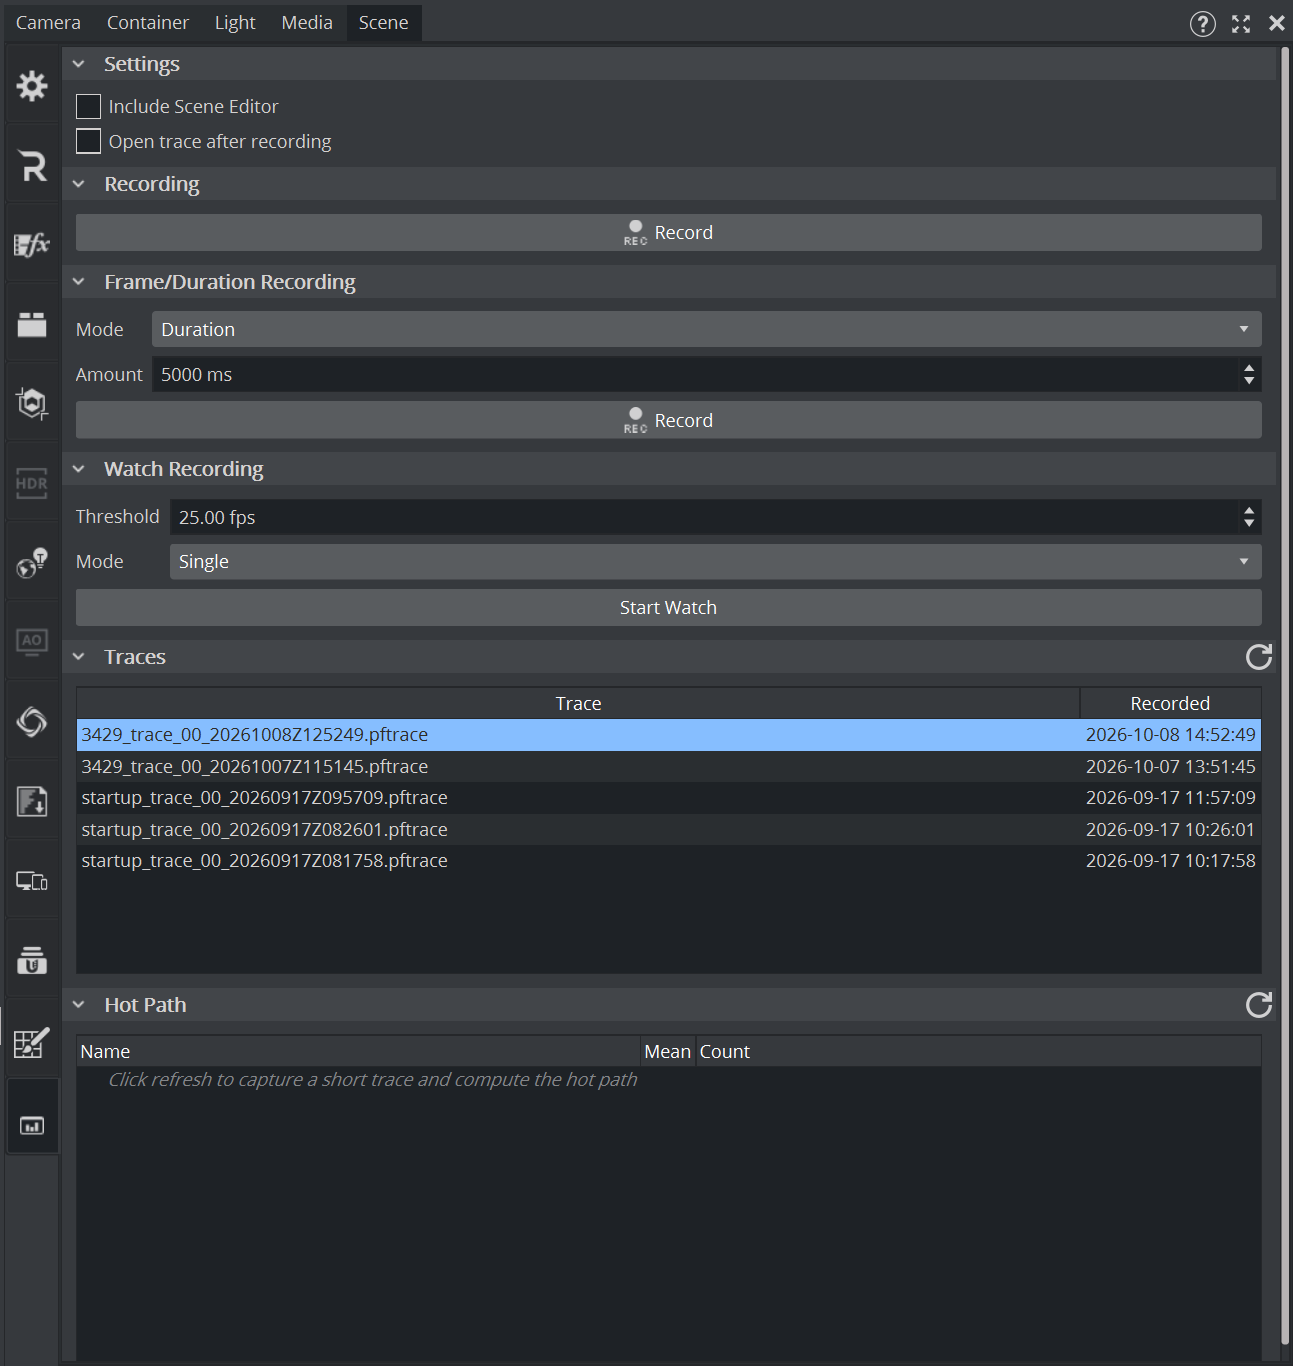
Recording a Trace
Prepare the system so the problem can happen, for example by loading the affected scene and taking it On Air.
Click Record Trace in the On Air toolbar, or Record in the Tracing tab.
Reproduce the problem. Keep the recording short: a few seconds that cover the problem are enough.
Click the button again to stop the recording. The trace file is saved automatically.
Open Performance Monitor > Tracing and find the new trace at the top of the Traces list.
Drag the trace from the list straight into your support ticket, an email or a folder.
Tip: If the problem is hard to reproduce on demand, use Watch Recording (see below). It waits for the frame rate to drop and saves a trace for you automatically.
Recording Options
Settings
Include Scene Editor: Also records what the scene editor does, not only the renderer. Turn this on if the problem happens while you work in Viz Artist rather than On Air.
Open trace after recording: Opens each finished recording in the trace viewer straight away. Off by default: new traces only appear in the Traces list.
Recording
Record / Stop: Starts a recording and stops it when you click again. This is the same as the Record Trace toolbar button.
Frame/Duration Recording
Mode: Records either for a set Duration (milliseconds) or for a set number of Frames.
Amount: The duration (default 5000 ms) or the number of frames (default 300).
Record: Starts the recording. It stops by itself when the duration or frame count is reached.
Watch Recording
Watch Recording runs in the background and saves a trace only when the frame rate falls below a threshold. Use it for problems that happen only now and then.
Threshold: The frame rate (fps) that triggers a trace. Set it to your output rate (for example 50 or 59.94), or slightly below it.
Mode:
Single: Saves one trace at the first frame-rate drop, then stops watching.
Continuous: Keeps watching and saves a trace at every drop.
Start Watch / Stop Watch: Starts or stops watching.
Note: Only one kind of recording can run at a time. While a recording or watch is running, the other record buttons are unavailable.
Traces
The Traces list shows all recorded traces, newest first.
Trace: The file name. Hover over it to see the full path on disk.
Recorded: When the trace was recorded, in local time. The time in the file name is UTC.
Double-click: Opens the trace in the trace viewer.
Drag and drop: Drag a trace into a ticket, an email or a folder to copy the file.
Refresh: Reloads the list.
Hot Path
Hot Path gives a quick view of where time is spent right now, without opening a trace file.
Refresh: Records a short 3-second trace and shows it as a call tree. The time of that capture is shown next to the button.
The most expensive chain of calls (the hot path) is expanded and highlighted.
Name: The track or function.
Mean: Average time per call.
Count: Number of calls during the capture.
Hover over an entry to see its total time and self time, as a time value and as a share of the track.