Making the map react to how far you are zoomed in

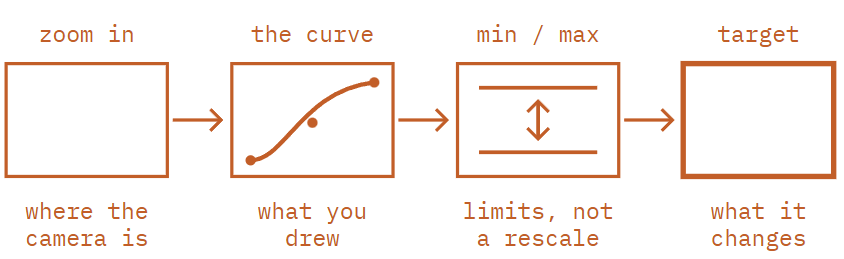
GeoExpression watches the map's zoom level and turns it into a number, following a curve you draw. That number then drives something else in the scene — a line that thins as you close in, a layer that fades up only over a city, a label that counts.
What it does
A map that looks right at country level rarely looks right at street level. Borders drawn thick enough to read across a continent turn into slabs over a city. Labels sized for a close-up disappear when you pull out. Detail that belongs on a regional map becomes clutter on a world one.
The fix is to make those values depend on the zoom rather than fixing them once. That is what GeoExpression is for: zoom goes in, a number comes out, and you decide the shape of the relationship between them by placing points on a curve.
If you have used zoom-dependent styling in a web mapping library, this will feel familiar. The difference is that the number does not have to style the map — it can drive a parameter on almost anything in your scene.
How to use the Plugin
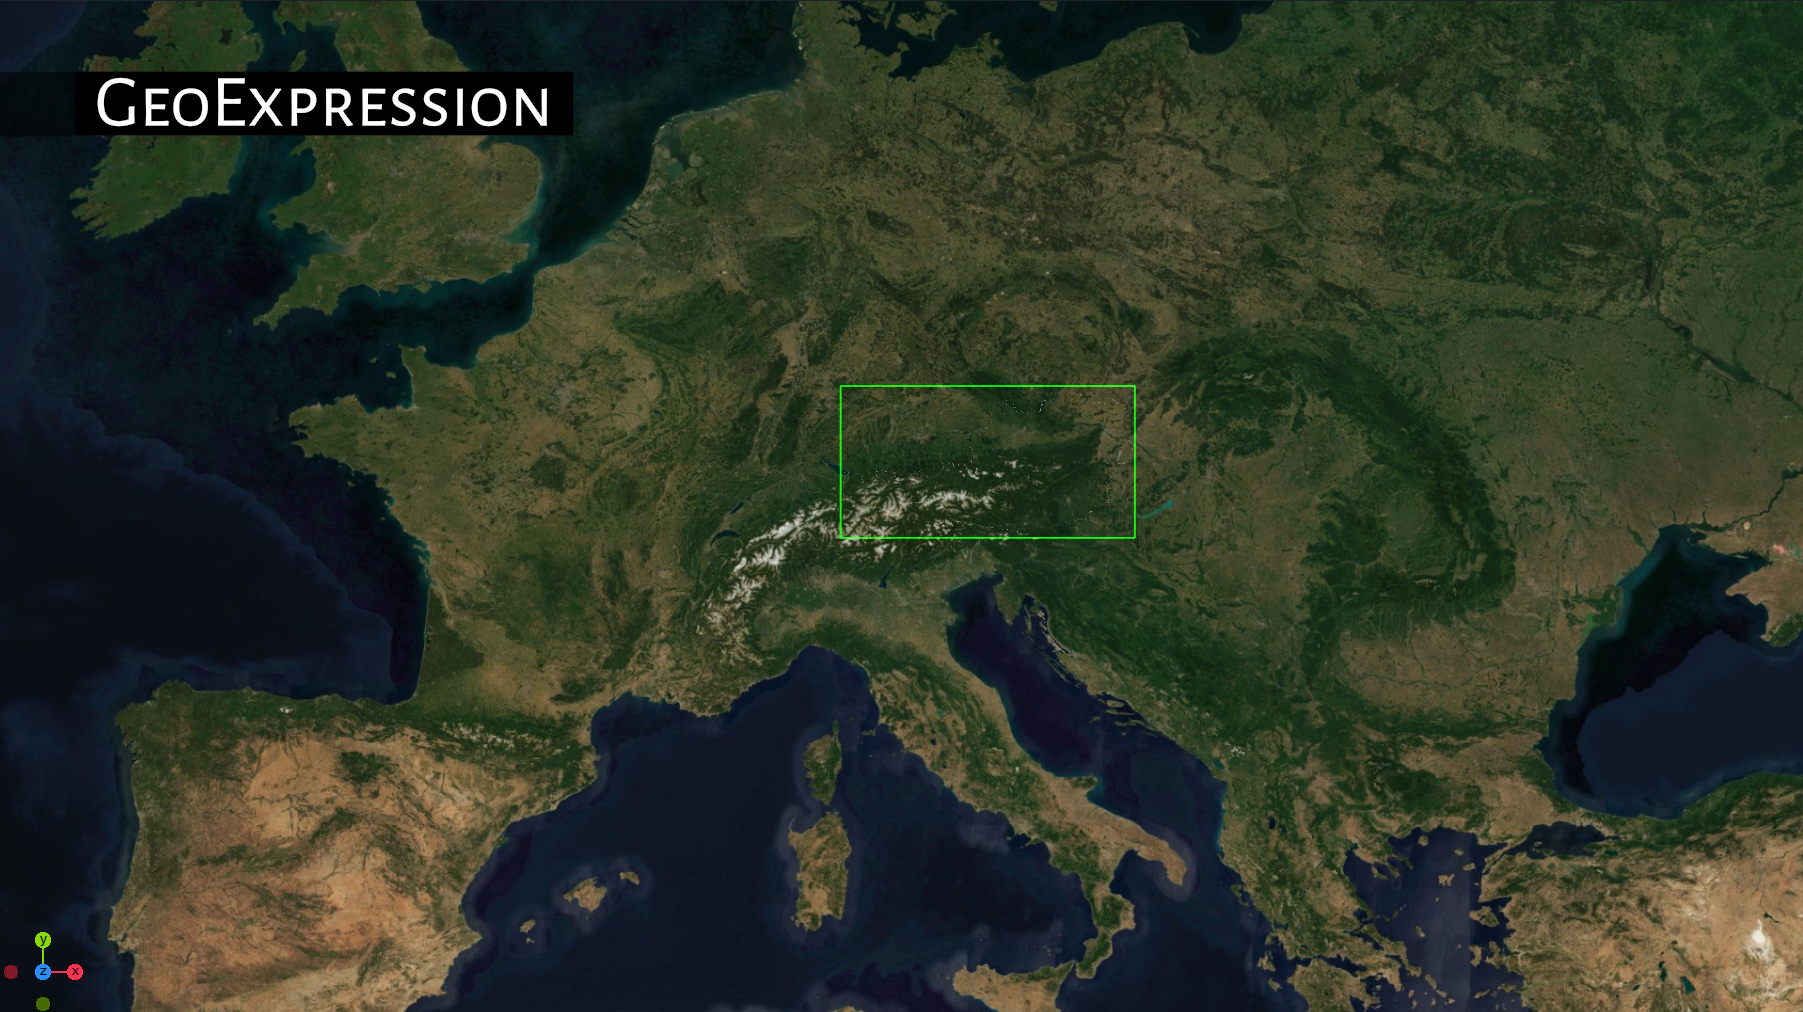
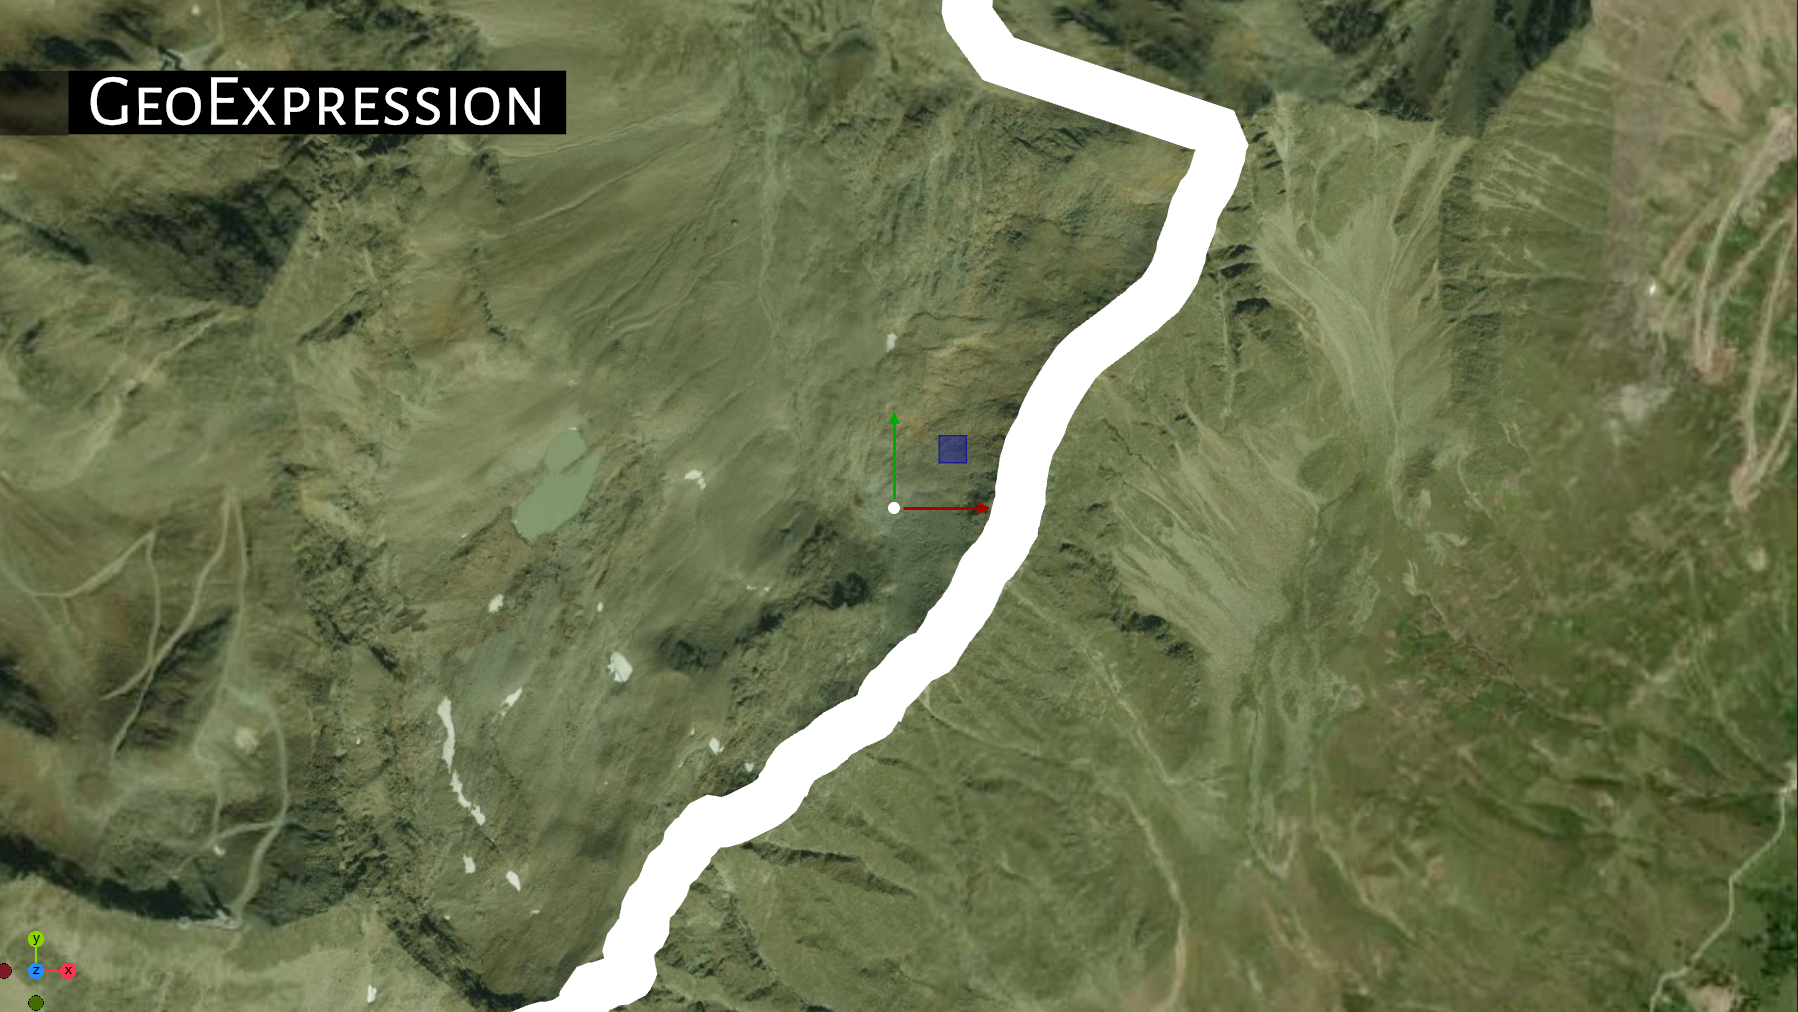
As an example we are using a country outline (from a GeoJSON). The problem is the following:
If we have a very far zoom, the outlines linewidth is hardly visible, on a very close zoom, it will cover mostly too much of our shot.
Put GeoExpression on the geometry
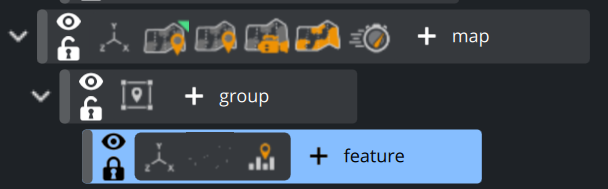
Drag the GeoExpression plugin onto the container carrying the GeoJSON geometry — the same container that has ControlGeoJsonGeometry on it. Not the map container: the expression belongs with the thing it changes.
Tell it what to drive
Set Target to Line Thickness. The plugin now knows its output is a line width, and will write it into the geometry and also all Child containers underneath it.
Adjust the values
Now zoom out. Our country border disappears. Put Max Value at 2500. Line thickness here is a real distance on the ground, so the numbers are large — a border metres wide is invisible on a map of Europe.
This is a limit, not a target. It stops the output going higher than 4000; it does not stretch your curve up to it.
The plugin shows you the current zoom level. With a maximum of 2500 the border should be visible now, even on a zoom level equal to Europe.
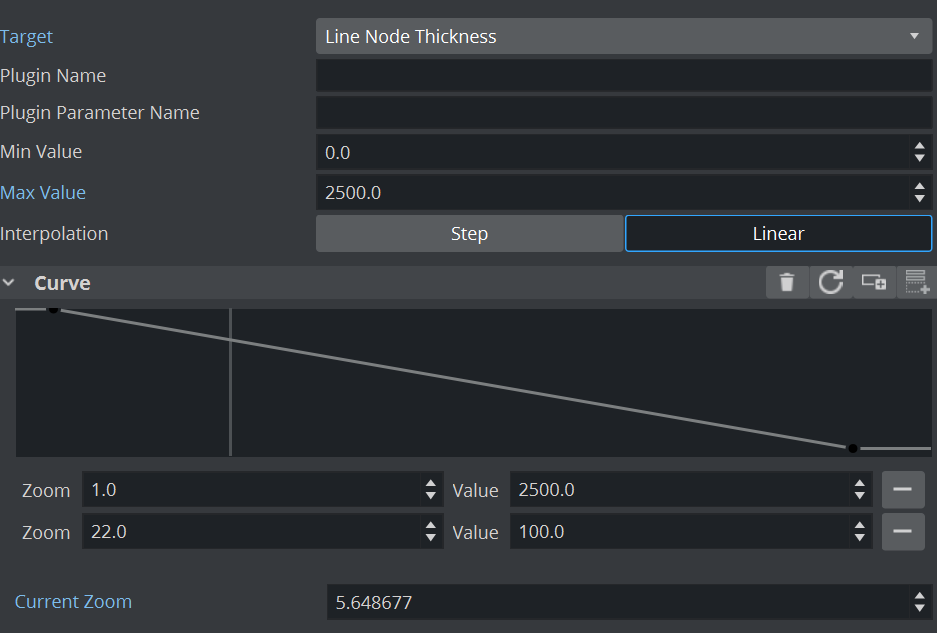
Now we have to adjust the width if we are on a very close zoom level. Set a Min Value, e.g. -2500 and adjust the values to match the width at a zoom level like e.g. 15.
You’ll notice that this is not a linear curve, it is more a logarithmic one. Therefore, it might be necessary to use more points to adjust the best looking value.
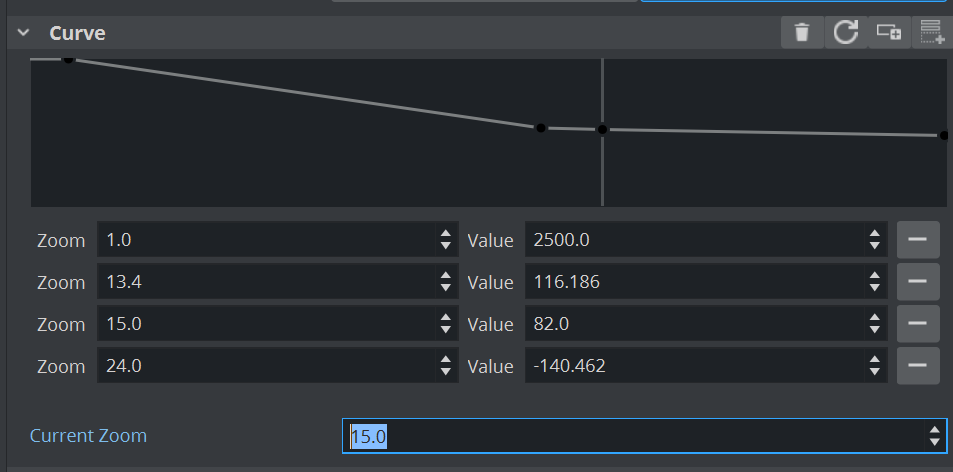
Place points relating zoom to thickness. This set works well for regional borders:
At zoom | Thickness | Reads as |
|---|---|---|
0 | 3620 | Whole world |
6 | 725 | A large country |
8 | 238 | A region |
11.4 | 39.8 | A city |
15.5 | 6 | A few streets |
Notice how steeply it falls — roughly a third of the thickness for every two zoom levels. That is not arbitrary: as you zoom in, the same piece of ground covers far more of the screen, so the world-space width has to shrink hard just to keep the line looking constant.
Check it by zooming
Move the map camera in and out. The borders should stay visually similar the whole way rather than bloating or vanishing. To check a specific level without moving the camera, type it into Current Zoom Level and watch Current Output Value — that pair is the fastest way to see what your curve actually produces.
Drawing the curve
The curve is a list of points. Each one pins an input — a zoom level — to an output — the value you want there. Between two points the plugin fills in the gap, and how it fills it is the one choice you have.
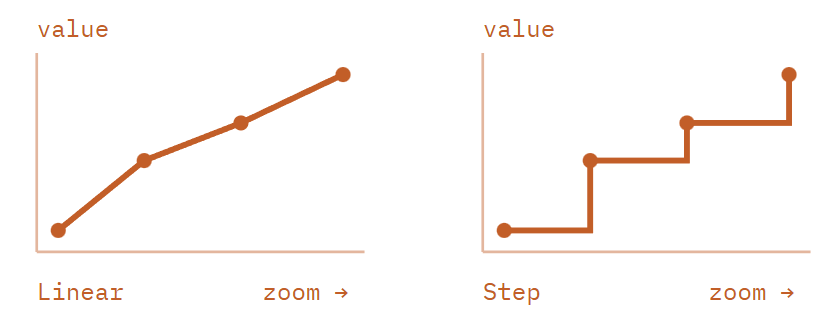
Linear blends smoothly between neighbouring points. Anything continuous — a width, an opacity, a size — wants this, because the change happens gradually as the operator zooms rather than snapping.
Step holds each point's value until the next point is reached, then jumps. Use it for decisions rather than quantities: a layer that is either on or off, a label set that appears wholesale past a threshold. Also worth a try when a linear fade looks mushy and a clean switch reads better on air.
Points are held in zoom order, and you need at least two for the plugin to have anything to interpolate between. Beyond your first and last point the value simply holds — a curve ending at zoom 15 keeps producing its zoom-15 value at zoom 20.
What it can drive
Alpha
The output drives the container's own colour and opacity, so the object it sits on can fade up and down with the zoom.
Reach for it when
A layer should only appear once the operator is close enough for it to mean something — district shading over a city, but not over a continent.
You want overlapping layers to hand over to each other rather than fight, one fading out as the other fades in across the same zoom range.
Line Thickness
The output becomes the line width of a GeoJSON geometry rendering in Line mode - see our example above.
Reach for it when
Borders, roads, rivers or routes have to stay readable across a wide zoom range.
Remember the width is a distance on the ground, not pixels. That is exactly why it needs an expression: a fixed ground width cannot look right at two different scales.
Plugin Parameter
The output is written into a named parameter of another plugin on the same container. Name the plugin and the parameter, and the value lands there every frame.
Reach for it when
This is the general case, and much the most powerful of the three.
A worked example: point it at a Counter plugin's number and the rendered text becomes a live readout that changes as the operator zooms.
The same route drives text size, a shader input, a geometry parameter — anything a plugin exposes as a number.
Script Parameter
As with the Plugin Parameter, the value is passed over to a script. It needs to expose a parameter of double type.OnParameterChanged will get notified once the value changes.
Reach for it when
Whenever you are limited by Plugin Parameter option.
To implement custom logic when needed
Using Plugin Parameter mode
If Alpha and LineThickness do not work, the GeoExpression Plugin can talk to any other plugins. For example, we write the normalized value into a Counter Plugin.
Create a subcontainer under your GeoCamera/GeoCanvas container. Add a Font, a Counter Plugin and the GeoExpression on it.

Click on initialize on the Counter plugin and the value should already be taken.
Using Script Parameter mode
If you need to implement your own logic or if you are limited by the other options, go for a simple script. For example you can have the zoom level driving the rotation of an “Elevator” indicator.
Create a script like
Sub OnInitParameters()
RegisterParameterDouble(“zoom”,”Zoom”,0,0,360)
end sub
sub OnParameterChanged(parameterName as string)
this.rotation.z = GetParameterDouble(“zoom”)
end sub
Setup the GeoExpression plugin to use script mode, pass 'zoom' as the parameter name.
You have to set values for the Zoom level. If there is no “translation curve”, it can’t send any value
In our case make Zoom level 0 → 0, Level 24 → 360.
This will now apply a rotation to a container, based on the zoom level of our map.
Tips and troubleshooting
Values look capped - Min and Max are limits.
They clip the curve, they do not scale it. Raising Max Value will not make a curve that tops out at 100 produce more — edit the curve instead.
Nothing changes as you zoom - Check the two live fields.
Type a zoom into Current Zoom Level and read Current Output Value. If the output moves, the curve is fine and the problem is the target; if it does not, the problem is the curve.
Plugin target does nothing - Check the parameter's internal name.
Plugin Parameter wants the name the plugin uses internally, which often differs from the label in the editor. A wrong name fails quietly.
The change is too abrupt - Add a point, or switch to Linear.
Step jumps by design. On Linear, a sharp corner usually means two points sit close together in zoom but far apart in value.
Getting the numbers right - Sample, do not guess.
Set the camera where the shot will be, note the zoom, tune the value until it looks right, and add that as a point. Three or four sampled points beat a curve derived on paper.
Beyond the ends - The value holds flat.
Past your last point the output stops changing. If a shot beyond that range looks wrong, add a point out there rather than reshaping the middle.