Service Host
Version 1.0 | Published November 15, 2017 ©
Control Mode
The Control Mode plugin is registered as a Windows Service when the Service Host is installed. This service is the administration point for this Service Host. The shortcut to the Control Mode of the current Service Host can be found at %ProgramData%/vizrt/ServiceHost/ServiceHost.control. It provides a REST interface to access the following functionalities.
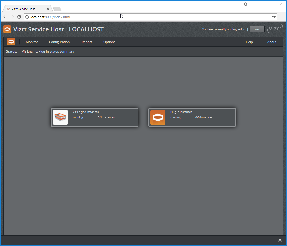
Welcome Screen in Control Mode
On the welcome page, the first thing to do is to log in. The login name is used to log all interactions with the Control Mode. The login name can be viewed on the upper right of the GUI, next to the Login/Logout button.


Viz Engine
The Control Mode is aware of Viz Engine instances on the local machine. They can be controlled from here.
Follow the menu Monitor>Viz Engine
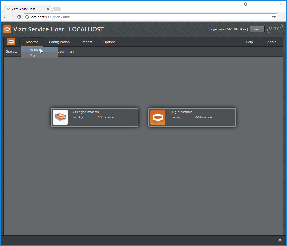
to go to this screen.
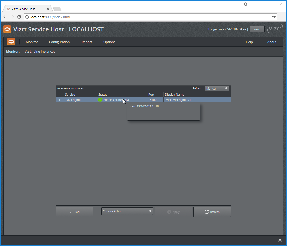
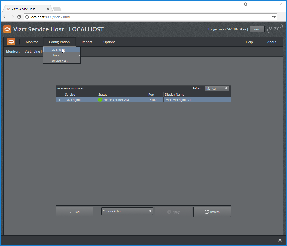
Viz Engine Monitor
Start a Viz Engine instance
From the Viz Engine Instances Monitor page, one can use the context menu on an individual Viz Engine instance or use the action bar on the bottom of the screen to start Viz Engine instances.
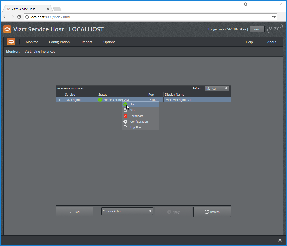
The page is not automatically refreshed by default. This is due to performance reasons to keep the impact on the Viz Engines as minimal as possible. To check for a proper launch or terminate use the Refresh button or set a refresh rate.
Precondition
-
The Viz Engine needs to be installed at the default location
Postcondition
-
start: a Viz Engine was launched without GUI and without console
-
start: the launch may have failed. Please check the reason in the logs. Context menu Logs or Menu Report>Logs>Viz Engine
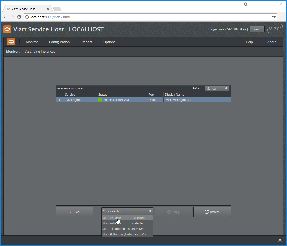
Stop a Viz Engine instance
From the Viz Engine Instances Monitor page one can use the context menu on an individual Viz Engine instance or use the action bar on the bottom of the screen to stop Viz Engine instances.
The page is not automatically refreshed by default. This is due to performance reasons to keep the impact on the Viz Engines as minimal as possible. To check for a proper launch or terminate use the Refresh button or set a refresh rate.
Precondition
-
The Viz Engine needs to be installed at the default location
-
The General Comm. Port of each Viz Engine instances need to be configured properly. Otherwise, the control instance will not be able to stop the specified Viz Engine instance correctly.
Postcondition
-
stop: the Viz Engine instance was sent the EXIT command.
The shutdown of a Viz Engine may take some time. To kill the process, with all consequences, use Terminate from the context menu.
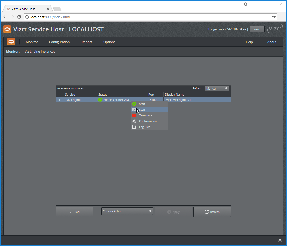
View Viz Engine Configuration
The config file of a Viz Engine instance can be viewed either from the Context menu on the Monitor page or via menu Configuration>Viz Engine
From there one can select the Viz Engine instance
Viz Engine Configuration Instance Selection
The page is view only.
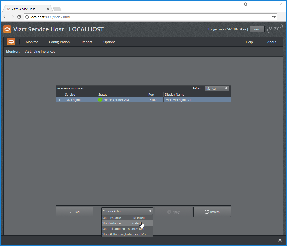
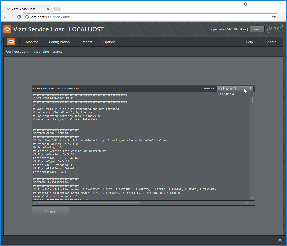
View Viz Engine Logs
The log file of a Viz Engine instance can be viewed either from the Context menu on the Monitor page or via menu Report>Logs>Viz Engine.
From there one can select the Viz Engine instance to filter the available log files and how many lines to display.
Viz Engine Logs
Plugins
Register a Plugin Instance
To register a new instance of a plugin as a Windows Service, use the menu Configuration>Plugin-in>Register New Instance.
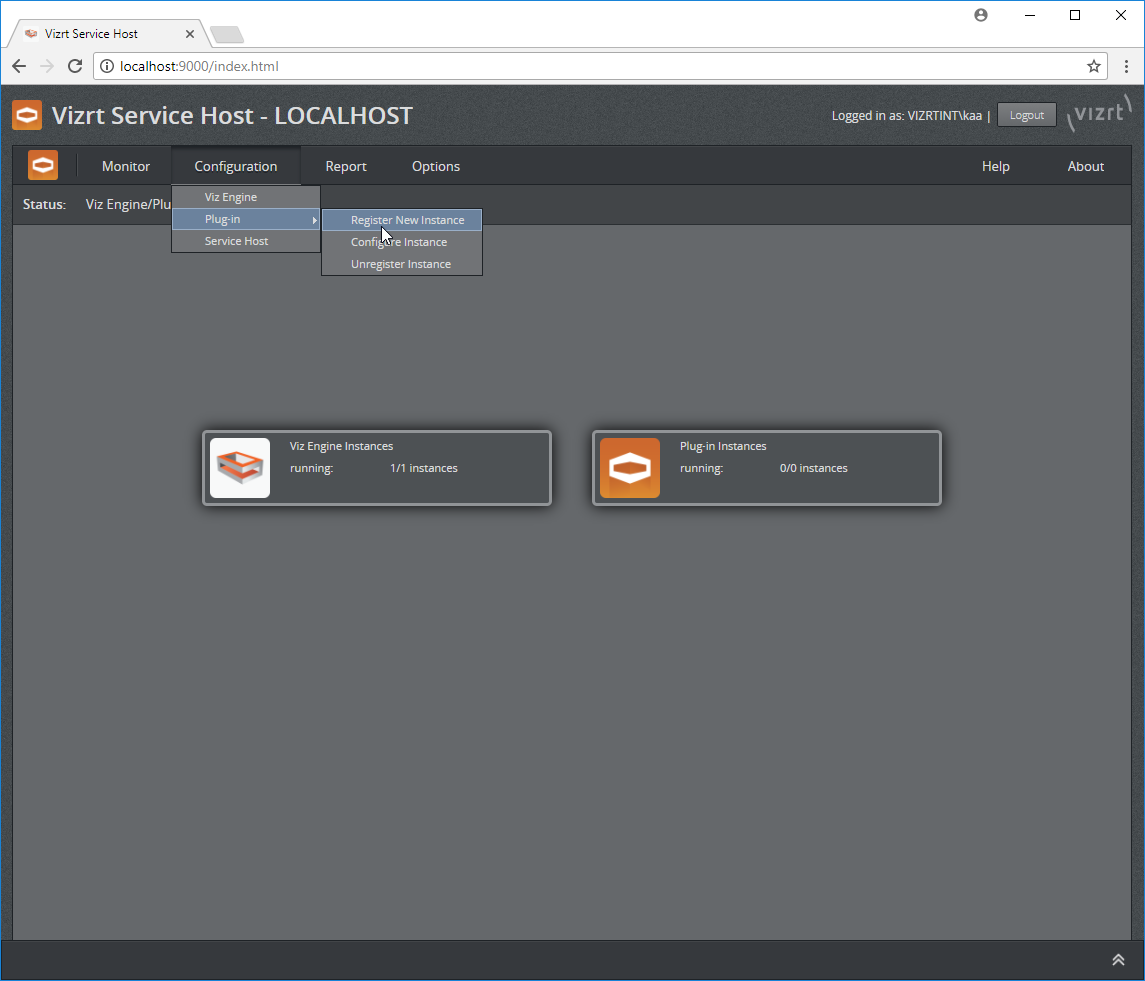
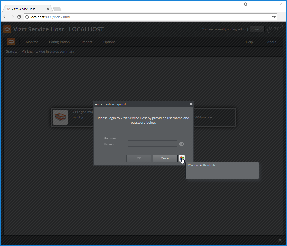
Register a New Plugin Instance
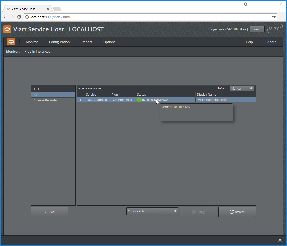
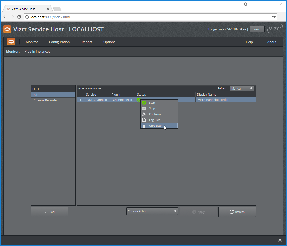
On the following screen one can select the plugin type and give the instance a service and display name. E.g. register a Channel Recorder:
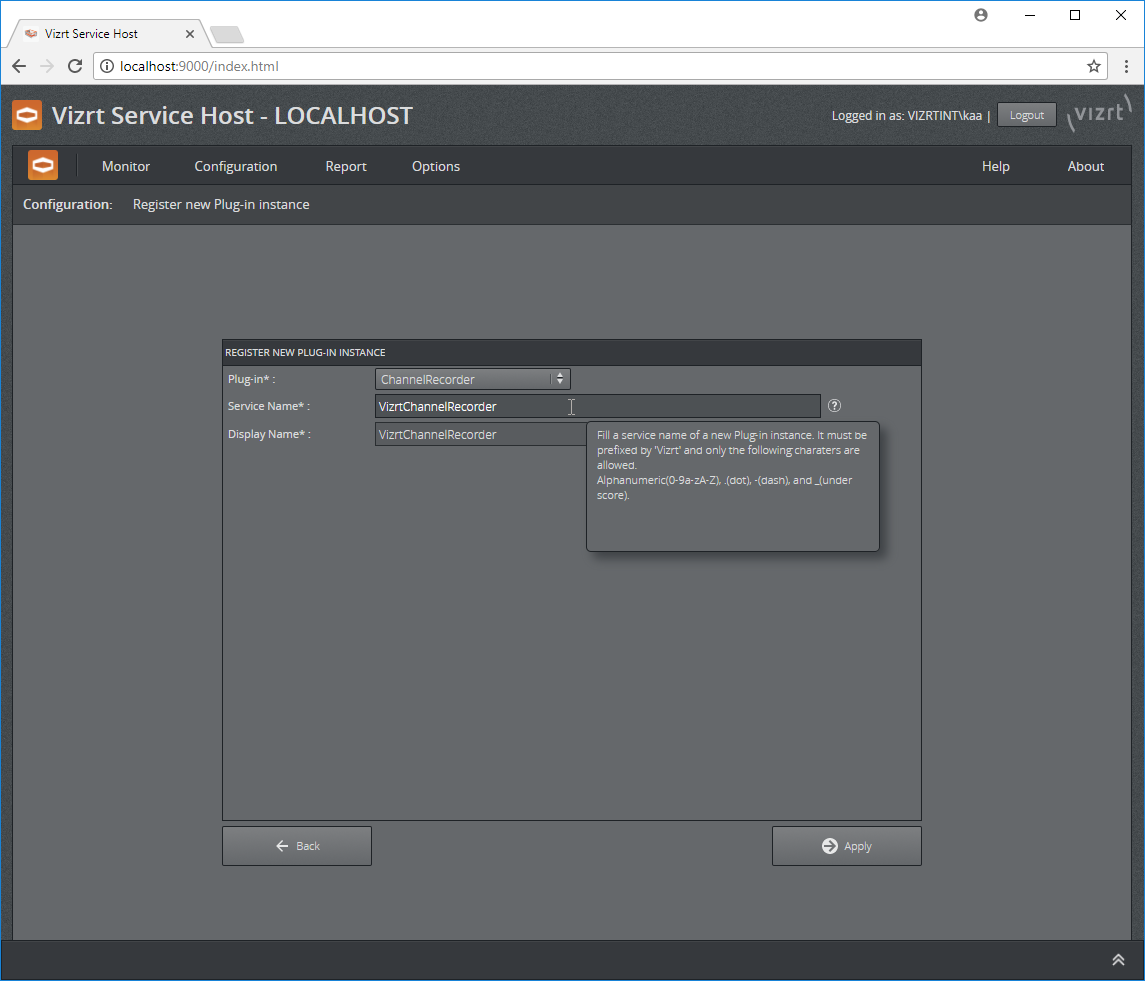
Confirm with Apply. The dialog allows to go directly to the configuration of this plugin instance.
Configure a Plugin Instance
The configuration of a plugin instance can be reached from the Monitor plugin page via the context menu of a plugin instance or via the menu Configuration>Plug-in>Configure Instance.
Configure a Plugin Instance
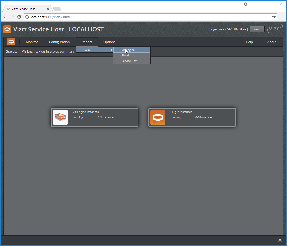
Plugin Monitor
The plugin monitor page can be reached via the menu Monitor>Plugin or from the welcome page by clicking on the Plugin-in Instances icon.
Plugin Monitor
On this page we have a filter to the left hand side to select from the available plugin instances. Each concrete entry on the right hand side has a context menu that allows us to also unregister this plugin instance.
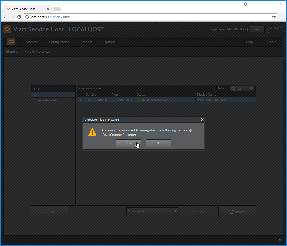
Unregister a Plugin Instance
The context menu provides the capability to unregister a plugin instance. Once selected and the following dialog has been answered with Yes then the plugin instance is stopped if it was running and then unregistered from the Windows services.
Any log and configuration files remain in ProgramData in order for later use by a subsequent new registration.
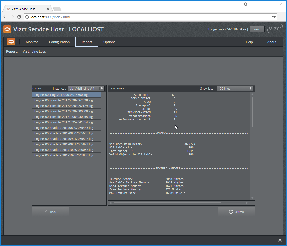
Report/Logs
The logs can be reached either via the context menu on the plugin monitor page or from the menu Report>Logs>Plug-in.
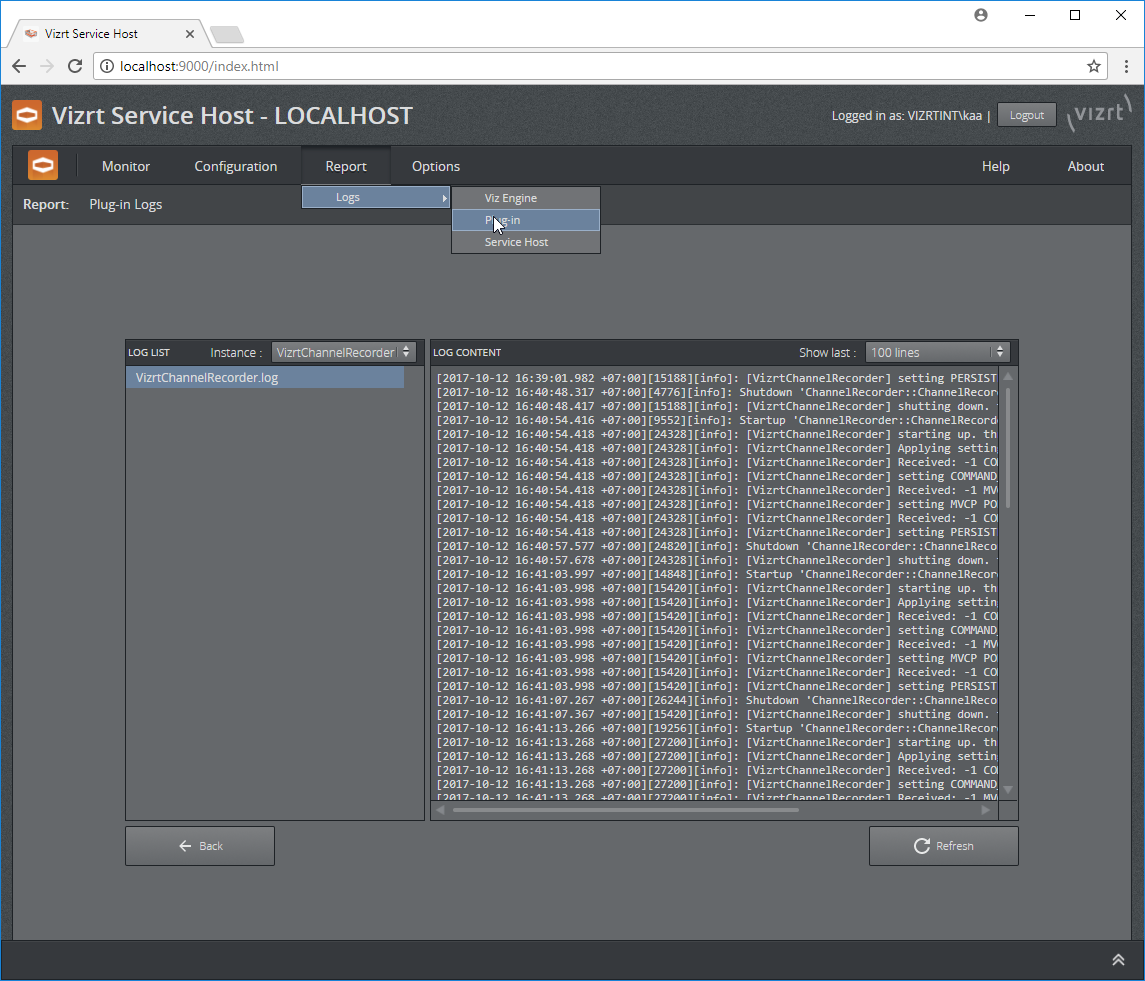
Plugin Logs
To the left there is the instance filter and the content of the selected log file is displayed on the right section of the screen. The number of lines displayed can be selected. It operates like the tail command.
Service Host (Control Mode)
The Control Mode itself can be configured too. For security reasons, the configuration of the Control Mode needs to be configured only by admins.
Configuration
The configuration page for the Control Mode may be reached via the menu Configuration>Service Host.
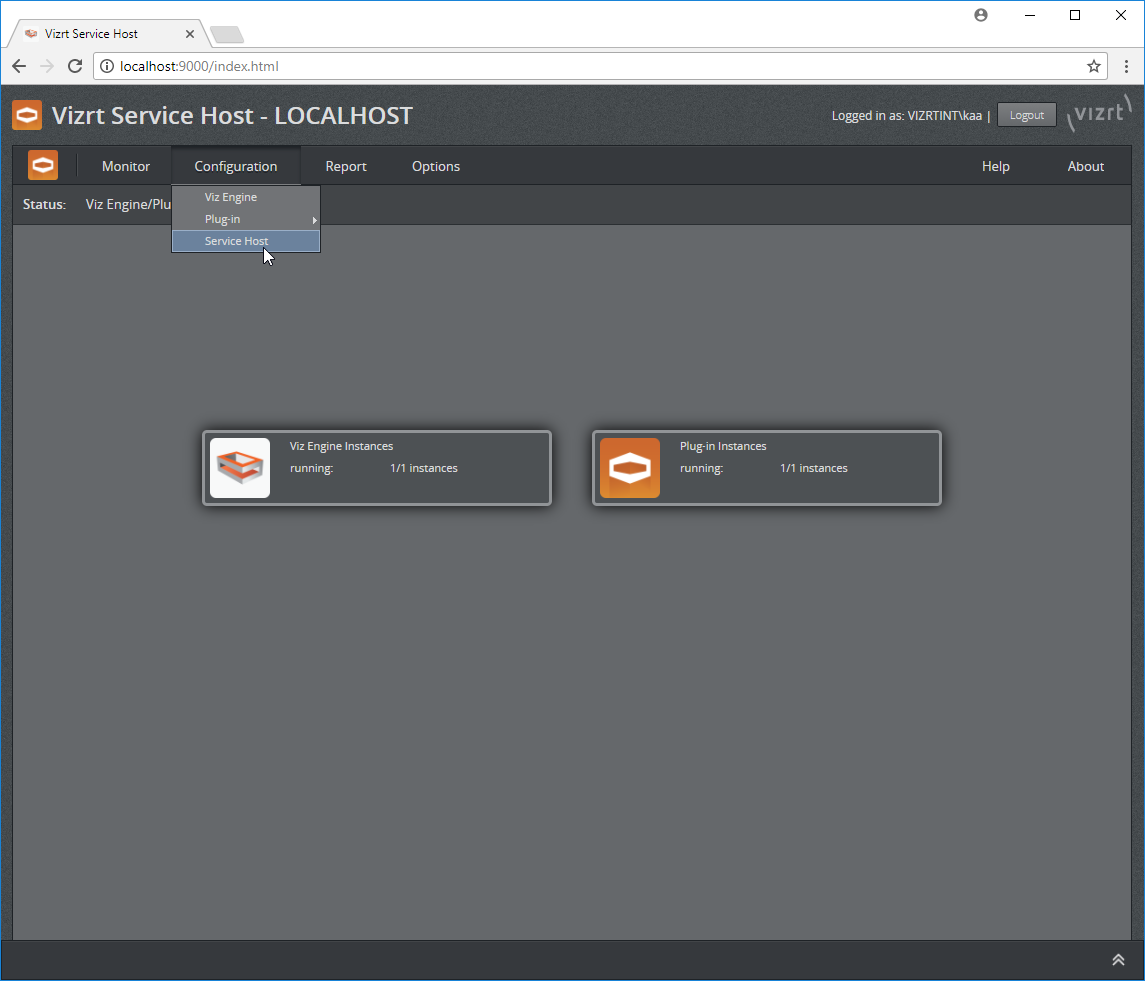
Control Mode Configuration
On this page the REST listening address can be configured. By default, Service Host is listening to all interfaces. This is specified by [All interfaces] in the Listen to field. As port number, any valid and unused port number may be used. Later versions may support automatically finding of an available port number.
The Access Treat Type allows to control who is able to interact with the Service Host.
-
Only local access(LOCAL_ONLY)
To allow only users accessing the GUI via the local machine to change the sysyem(such register/unregister new plugin instance, or start/stop Viz Engine instances). For users accessing the GUI from external machine whether authenticated or not are not allowed to do any changes.
-
Authentication required(AUTHENTICATION_REQUIRED)
Same as above, Only local access, except that users accessing from external are allowed as well as long as they are authenticated. In future versions this may change to all users are required to authenticate before they can make changes to the system.
-
No authentication(NO_AUTHENTICATION)
No restrictions apply. All users may change the system, whether local or from external. We do no recommend this setting since there is also no way of having a user information in the operating logs.
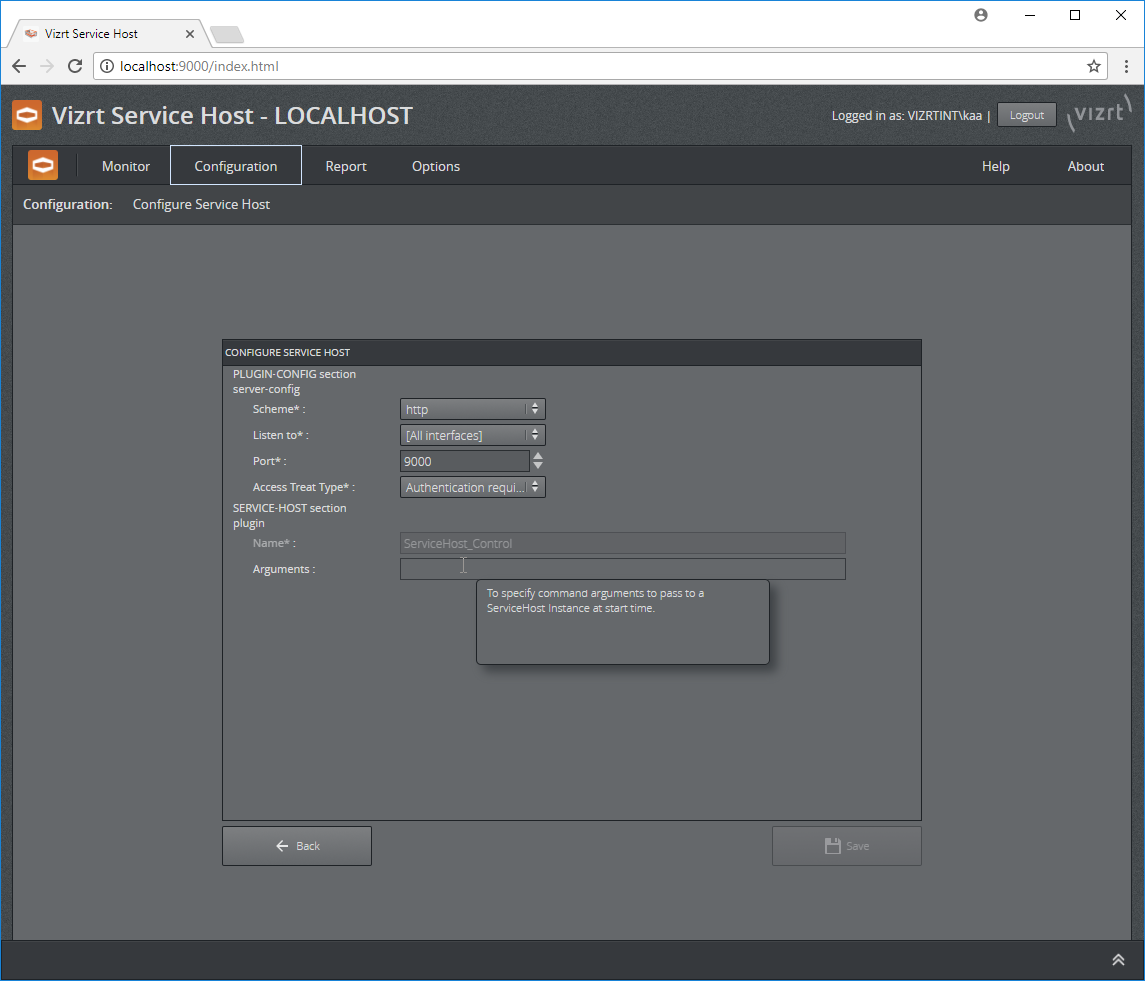
Control Mode Configuration
The Arguments edit lets one pass arbitrary startup arguments to the control mode plugin. In this case we set the log level to debug mode.
Allowed values for Arguments are
-
-l debug
-
-l info
-
-l warning
-
-l error
-
-l off
Report/Logs
The logs produced by the control mode may be accessed via the menu Report>Logs>Service Host.
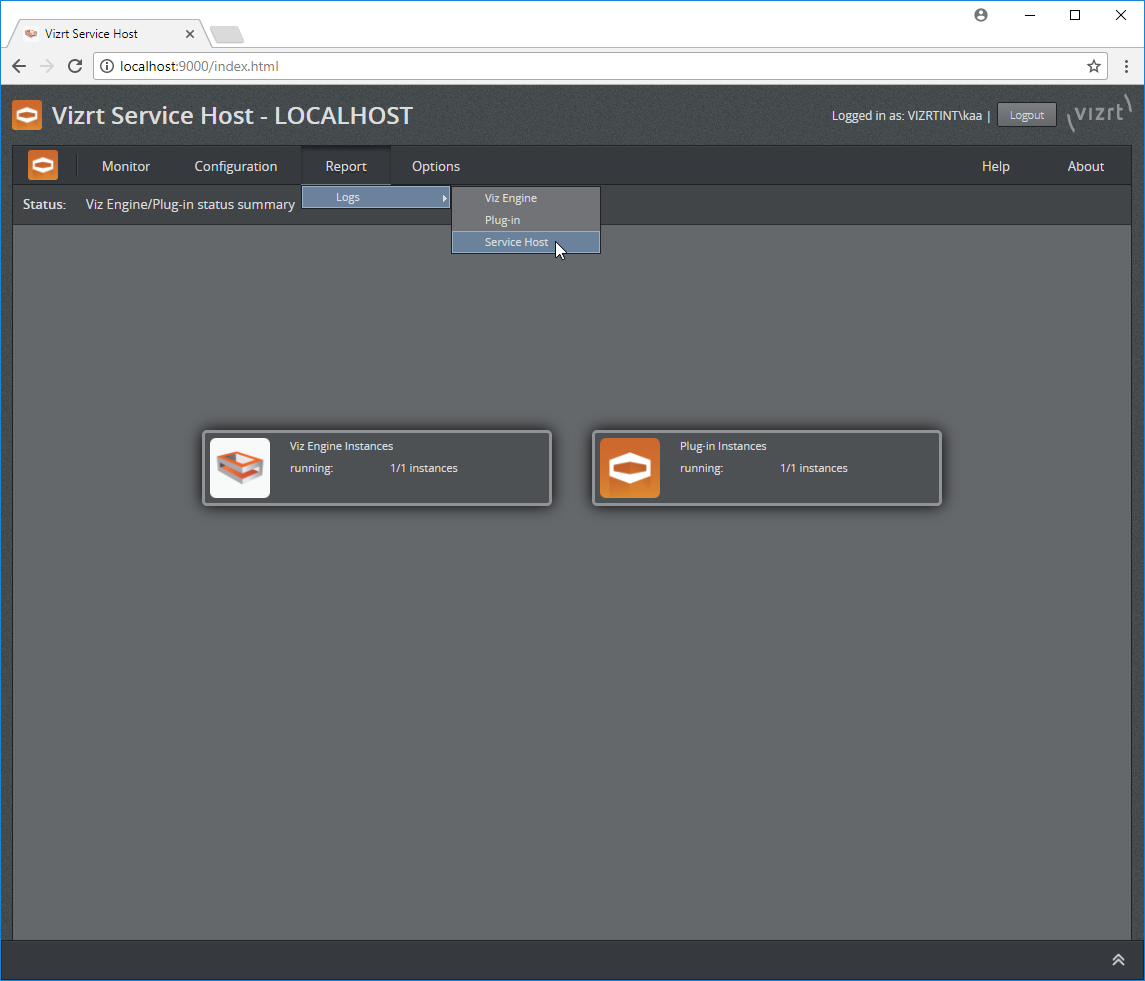
Control Mode Logs Navigation
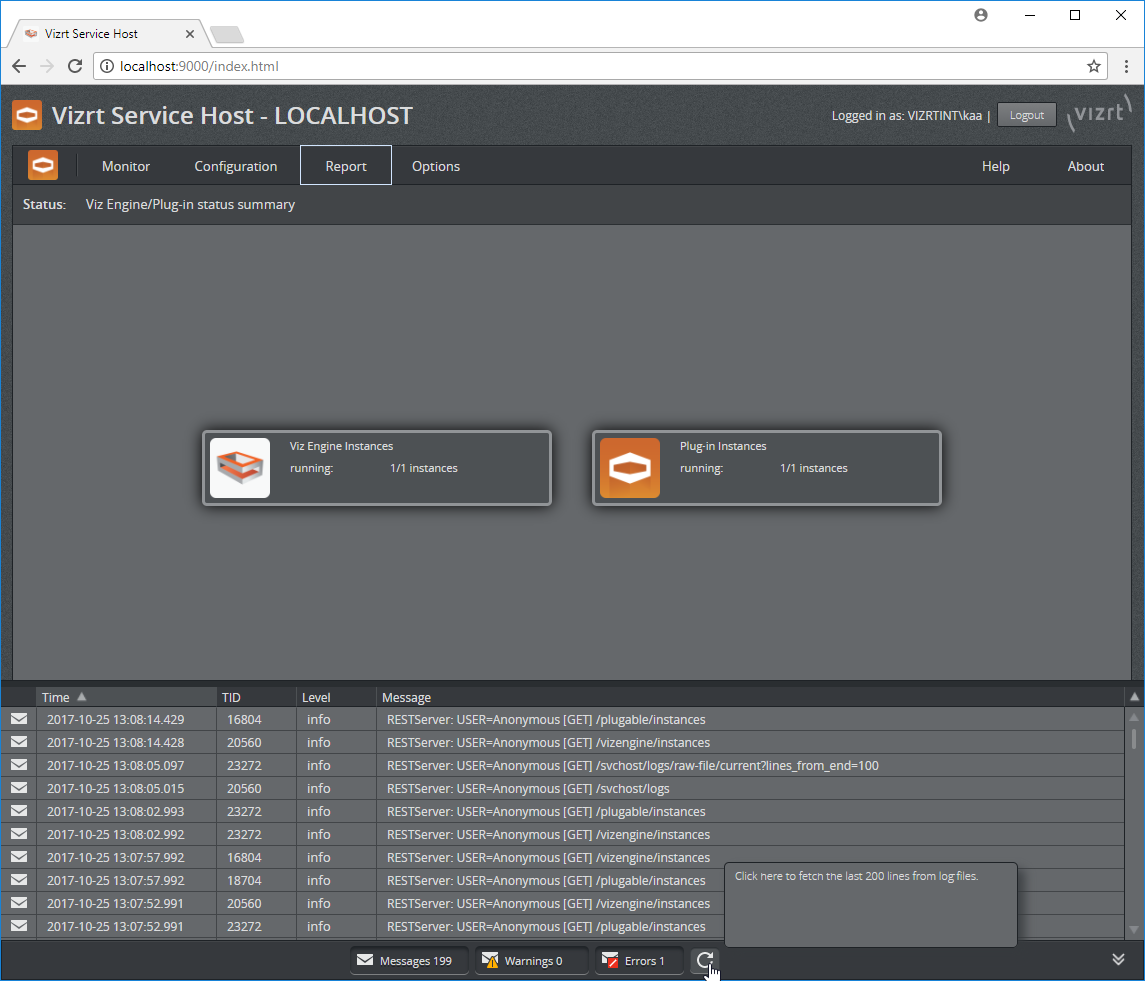
On the left hand side one can select the log file to be displayed. There are two types of logs to be found.
The Control Mode log
This log file is named ServiceHost.control.log It does log rotation and may also be reached via the log panel on the bottom of the screen.
 and
and 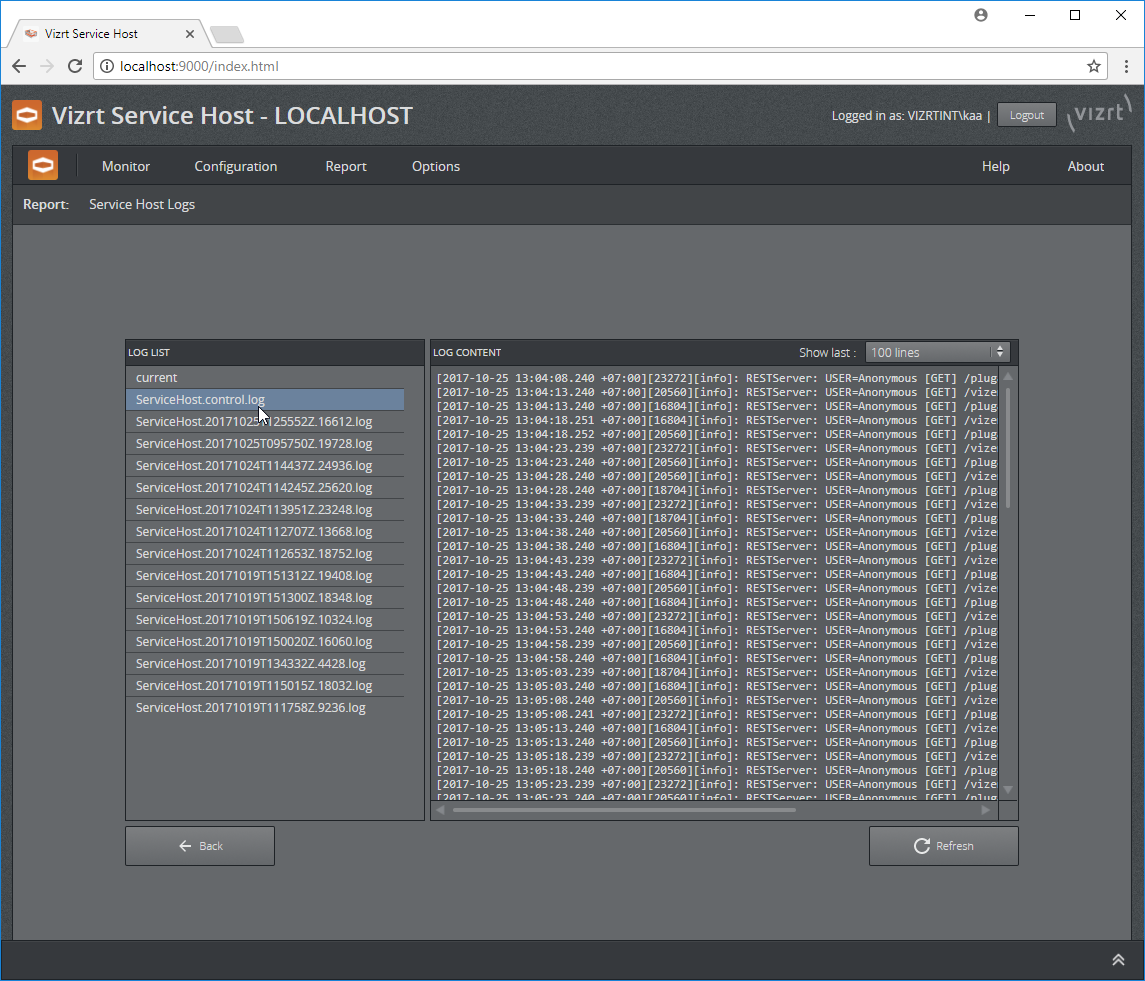
Service Host Startup Logs
This is produced during startup and kept as long as this Service Host is running. That way one can capture possible startup issues before a plugin is loaded and initialized. These log files are removed after a successful shutdown. They are named ServiceHost.dateandtime.pid.log where dateandtime is the date and time in Z timezone, pid is the process id.
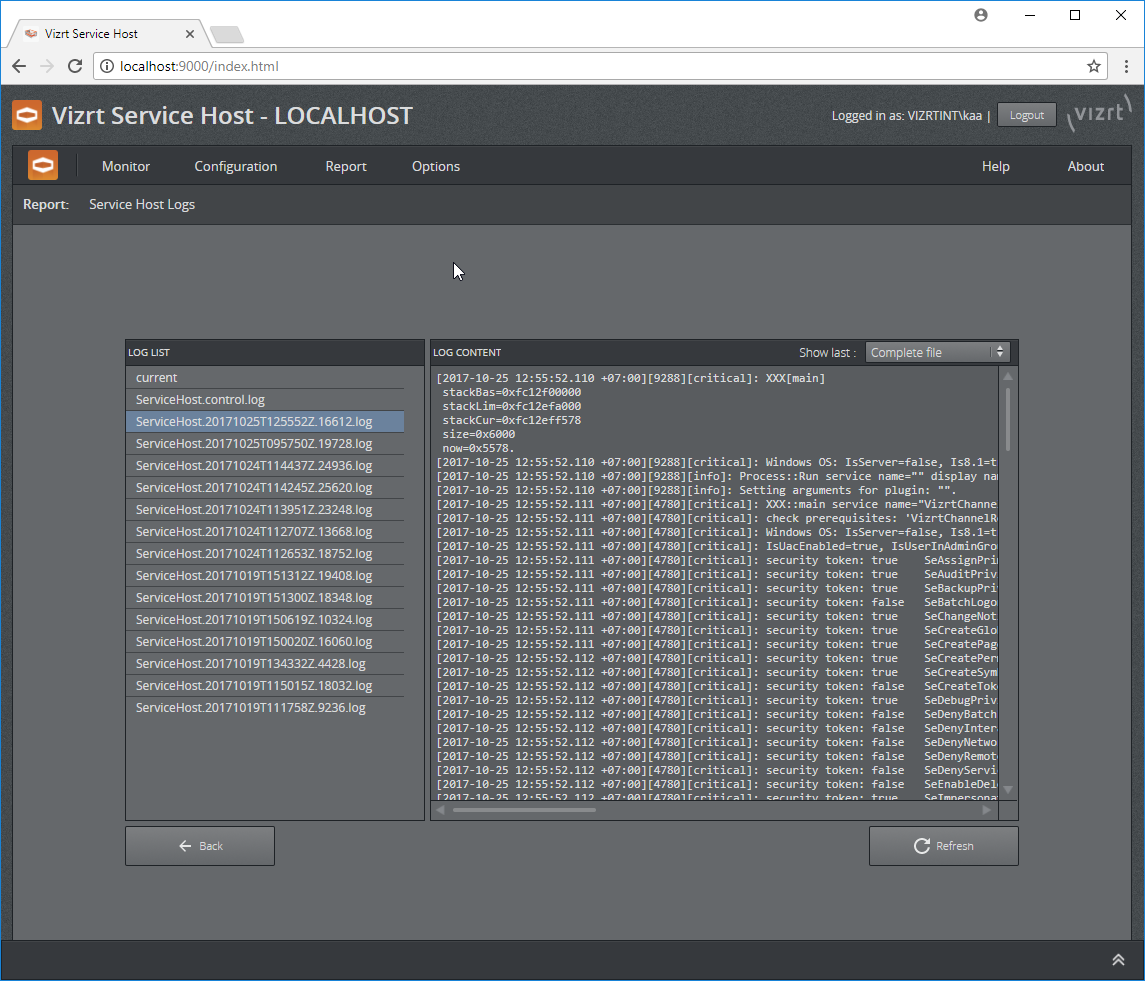
Startup Logs
Debugging of Service Host
Manual Register/Unregister and Stop/Start
The Service Host itself is capable to register/unregister itself as Control Mode service. This might be useful in cases not covered by the installer.
Z:\> ServiceHost.exe -c -i Z:\> ServiceHost.exe -c -rThe Service Host in Control Mode can also be started and stopped from the command line.
Z:\> ServiceHost.exe -c -s Z:\> ServiceHost.exe -c -kLaunch Service Host in Foreground With a Console Window
For debugging the Service Host can be launched in foreground and with a console window attached. To list all the possibilities use the command line switch -h
Z:\>ServiceHost.exe -hUsage:$0 [-v] ... start from within windows services, optional verbose mode$0 [-v] -N service_name -i ... install $service_name as service -v ... optional verbose mode$0 [-v] -N service_name -r ... remove $service_name as service -v ... optional verbose mode$0 [-v] -N service_name -s ... start service $service_name -v ... optional verbose mode$0 [-v] -N service_name -k ... kill service $service_name -v ... optional verbose mode$0 [-v] -N service_name -d ... run $service_name in debug mode with a console window -v ... optional verbose mode$0 [-v] -c -i ... install control as service, the service name is '{ProductName}.control' -v ... optional verbose mode$0 [-v] -c -r ... remove control as service, the service name is '{ProductName}.control' -v ... optional verbose mode$0 [-v] -c -s ... start control service, the service name is '{ProductName}.control' -v ... optional verbose mode$0 [-v] -c -k ... kill control service, the service name is '{ProductName}.control' -v ... optional verbose mode$0 [-v] -c -d ... run control in debug mode with a console window -v ... optional verbose mode-p "[argument...]" ... arguments that gets forwarded to the plugin e.g. -p "-l debug -v"What we are interested in here are the lines with the -d option.
To start the Service Host in the Control Mode with a console window make sure it is not running as windows service then launch it with -c -d options.
Z:\>ServiceHost.exe -c -kZ:\>ServiceHost.exe -c -doptionally add verbose and log parameters to the Service Host and the Control Mode plugin.
Z:\>ServiceHost.exe -c -d -v -l debug -p "-v -l debug"the first -v -l debug are for the Service Host executable and the one inside the -p option are forwarded to the Control Mode plugin. In the console mode, the logs are also forwarded to the console window.