Highlighting countries, regions, areas, streets, places, disputed regions - this is the main task when telling a story and using maps.
Therefore we will need to prepare our scene to allow a journalist to use GeoJSON data in various styles.
We will mainly use the same concept as we did for adding label designs - using Prototypes and ControlProtoList plugin.
Use your previous scene created in the Label design chapter or start from scratch.
Create a basic scene with GeoCanvas and GeoCamera.
Add a prototypes container.
Now we need to create designs for the shapes:
For each design, create a new container, e.g. region-red, region-blue, region-yellow
Add ControlObject plugins to the containers and check the “Is Prototype”.
This will make sure it will not show up as an additional control object inside the control application as this is only be used as a prototype.Drag the GeoJSON plugin on it and the ControlGeoJson plugin


This allows the GeoJSON shape data to be controlled from a control application.If you also want a label for your selected region, create a Subcontainer with Text, and ControlText plugin. Also add a ControlContainer to it and expose Lon/Lat.
Make sure all containers holding a GeoJson or Label are on GeoTransformation mode.
As a last step, we need to create a container, responsible to hold all regions on our map. This one needs to have the ControlProtoList plugin on it. Point it to your shapes prototypes and hit the Refresh button.
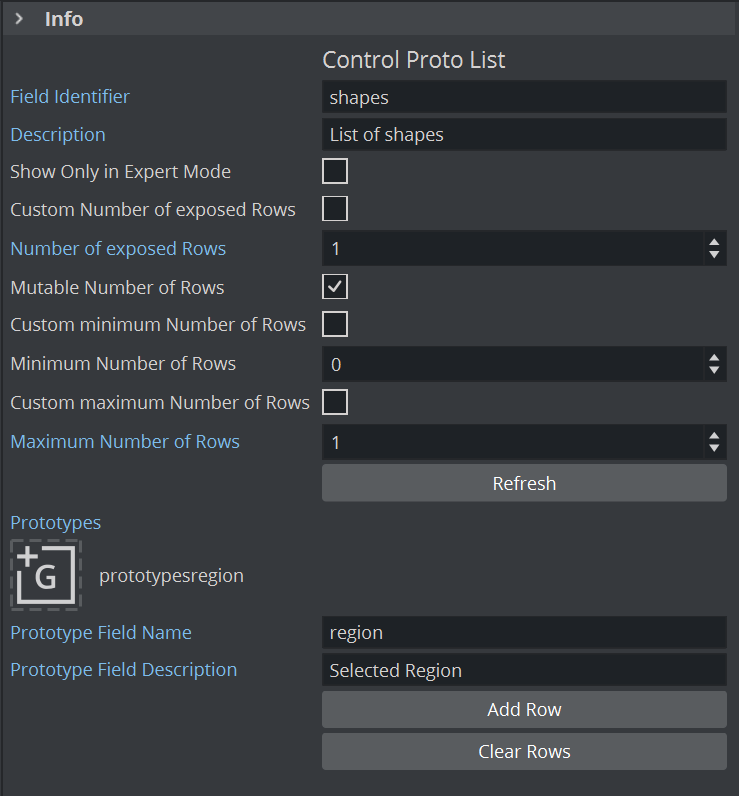
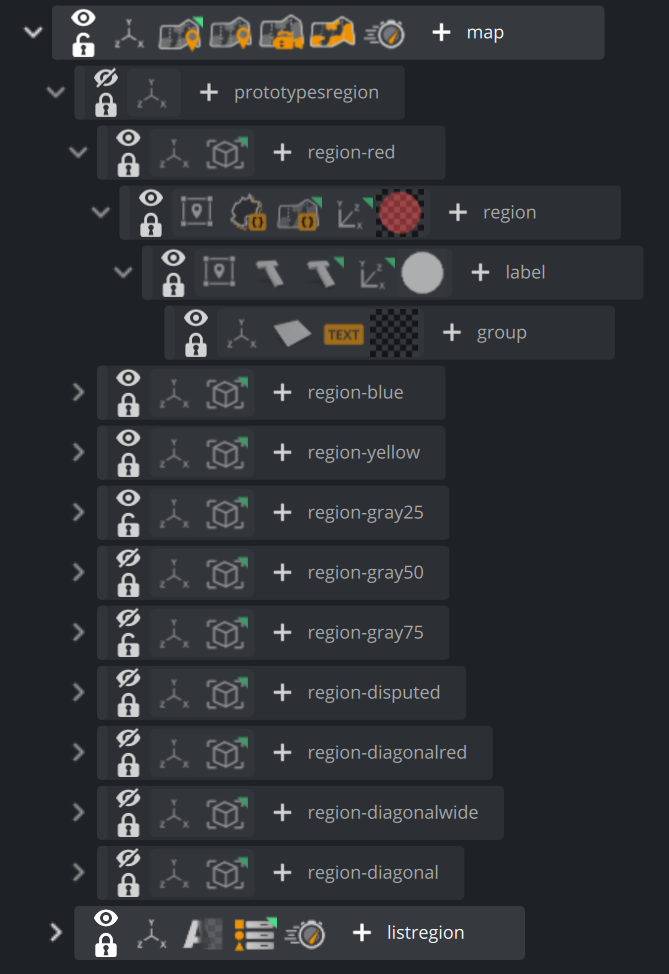
Save your scene and import it into your control application, e.g. Pilot Edge with Template Builder. The control application now exposes a list of configurable shape data, usually filled from the maps backend.

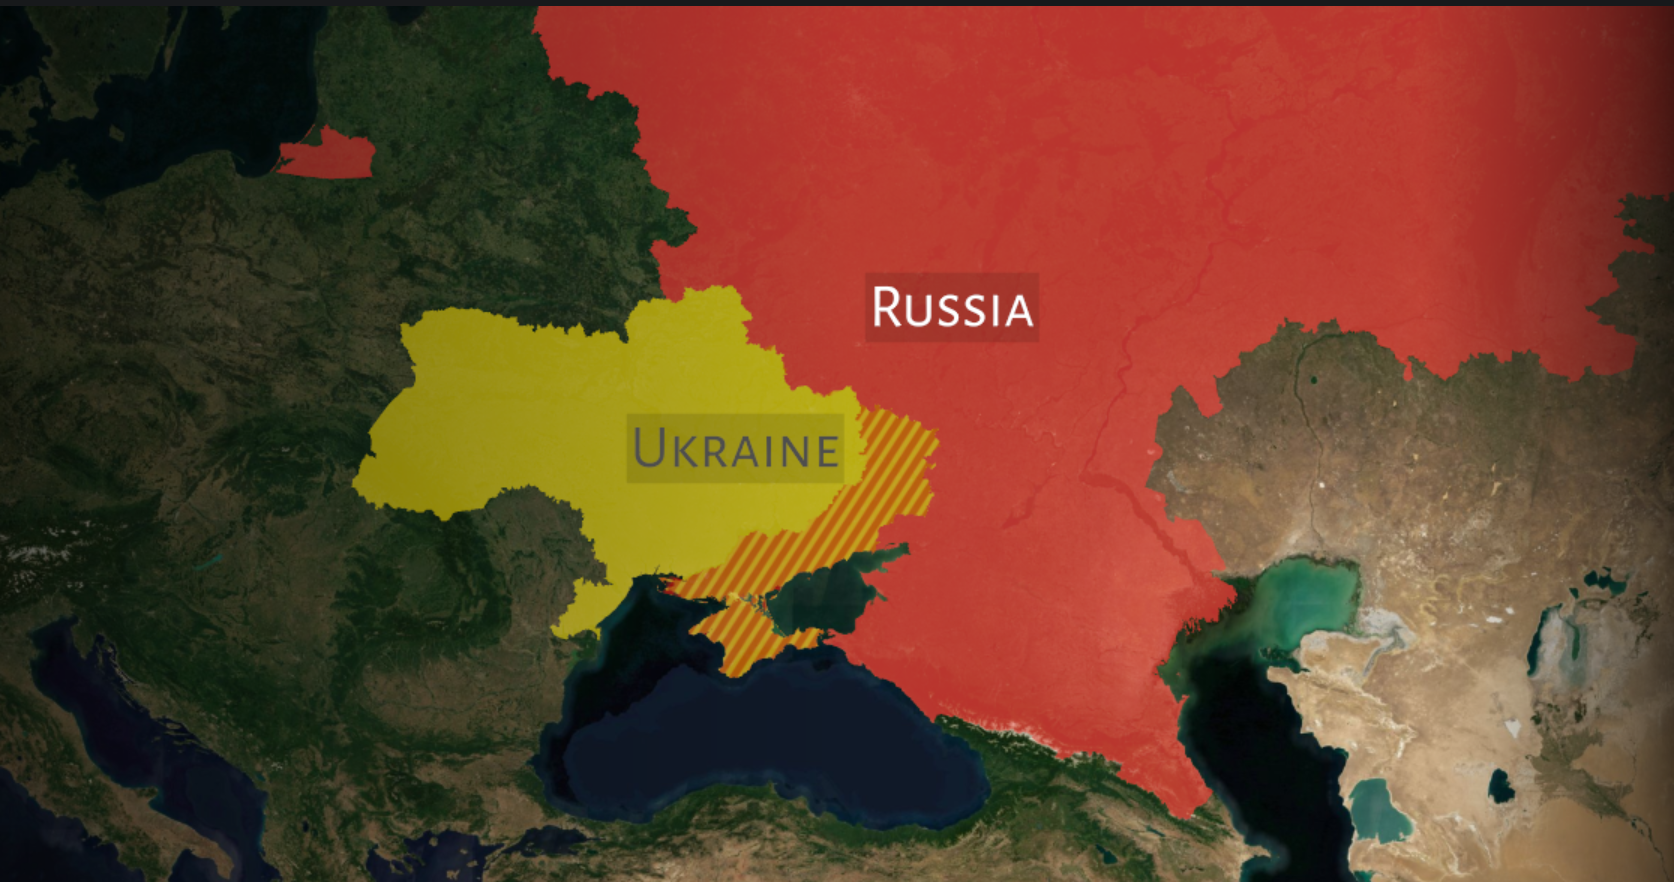
Shapedata can also be pasted manually and must not represent a country shape. It can also be a track of e.g. Tour de France or as in the sample above disputed regions.