What a GeoJSON can contain
A GeoJSON file is normally a collection of features. Each feature is one thing like a station, a district, a route and carries two parts: its geometry, the shape itself, and its properties, whatever the publisher chose to attach, such as a name, a population or a status.
Viz Engine only processes the geometry data, any labels or similar are ignored.
One GeoJSON can hold a mixture. A district dataset might have a polygon per district and a point per town hall in the same collection, and it will draw as one shape.
The geometry types
All seven types from the GeoJSON standard are supported. They fall into three families, and the family decides how the shape behaves when you switch between fill and line.
Geometry types and how they draw | ||
Type | Is | How it draws |
|---|---|---|
Point | A single position. | Marked at its coordinates. Nothing to outline, so fill and line look much the same. |
MultiPoint | Several positions as one feature. | As above, all of them together — every fire station in a district as a single shape. |
LineString | A run of positions. | A line. This is the family the reveal animation is for: routes, rivers, borders, journeys. |
MultiLineString | Several separate runs. | Several lines as one shape — a river with its tributaries, a road that is interrupted. |
Polygon | A closed outline, optionally with holes. | Fill draws the area, line draws the boundary. Holes are cut out of the fill, so a lake inside a region stays a lake. |
MultiPolygon | Several closed outlines. | One shape made of separate areas — a country with islands, a constituency in two parts. |
GeometryCollection | A mixture in a single feature. | Each part drawn as its own kind. Useful when one thing genuinely is a point and an area at once. |
Two forms of geometry
The same GeoJSON file can become two different things, and which you pick decides what you can do with it afterwards.
GeoJSON geometry
A geometry object in its own right, loaded from a file or from the database and dropped on a container like any other geometry. It is the straightforward choice for a shape that is simply there — a country outline that never changes, a set of regions that is part of your template's furniture.
It also has preloading controls, which matter for large datasets: you can ask for extra detail levels to be prepared up front, and for parent levels to be kept, so the shape does not visibly rebuild as the camera moves.
A GeoJSON node in a Dynamic Geometry
The flexible form. Here the shape is a node inside a dynamic geometry, which means it is generated on demand and can be changed while the scene is running — new data, a different draw mode, a different thickness, a reveal animation.
This is the form to choose when the data changes, when an operator needs control of it, or when you want the shape to animate. Everything from the fill-and-line settings onward in this chapter applies to it.
GeoJSON geometry - Fixed shape that is part of the design.
GeoJSON node in a dynamic geometry - Anything an operator loads, changes or animates. If you are not sure which one to use, take the dynamic geometry node. it can do everything the plain geometry can and more.
Where the data comes from
Usually a GeoJSON is served by the Maps backend server. However the data can also be provided by an external file, as part of a merged geometry on the Grapchi Hub or as external URL.
The source is set through the ControlGeoJsonGeometry plugin, on its input field. That field accepts three kinds of value (x,y,z), and the plugin works out which it has received.
GeoJson are often saved as .json instead of .geojson.
Please make sure to rename it to .geojson to allow Viz Engine to pick it up.
Static GeoJSON on Graphic Hub:
Pointing a scene at a file on disk is fine while you are designing. For anything you intend to keep, you rather bring the data into Graphic Hub, where it becomes a geometrical object like any other. You can just simply drag the file into Artist.
Importing is done as a background task. It might take some time until your file appears in the Asset view.
Two formats can be dropped in
GeoJSON (
.geojson) — the plain-text standard that every open-data portal publishes.FlatGeobuf (
.fgb) — the same shapes in a compact binary form. Much smaller and quicker to read, and increasingly offered alongside GeoJSON. For a large dataset, take the FlatGeobuf if there is one.
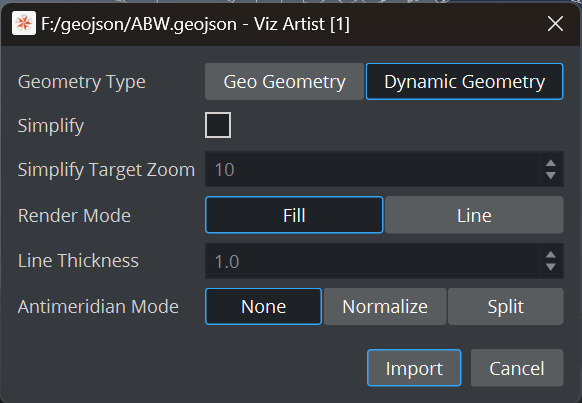
Choose your Geometry type (see above).
Simplification
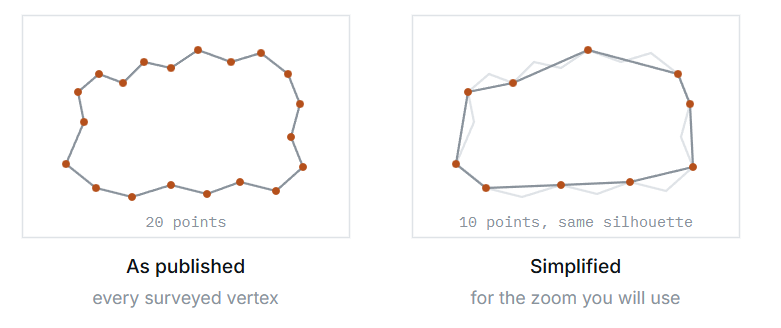
Open data is often far more detailed than a broadcast graphic needs. A coastline surveyed to the metre can carry tens of thousands of points; on air, at the zoom you are actually using, most of them land inside the same pixel.
Simplify thins those points out, and target zoom tells it how much detail to keep: the level you intend the shape to be seen at. Set it to the zoom you design for and the shape keeps the detail that shows, and drops the detail that does not.
Dynamic Data
There are three ways to get the data into the ControlGeoJsonGeom:
A file path | Data that ships with the scene or lives on the machine. You need to take care the data is available on every single engine playing this scene. |
A URL | Data published elsewhere and fetched at run time. Live feeds, an open-data endpoint, a newsroom service. This is mainly being used when operating in combination with Viz Maps backend. |
Inline text | Directly copy/paste the content of a GeoJSON. Very small shapes only. This is limited to 64K. |
Fill and Line Mode
A shape is drawn in one of two ways depending on the chosen render mode: filled as a solid area, or drawn as an outline. It is a single setting but it changes the whole character of the graphic.
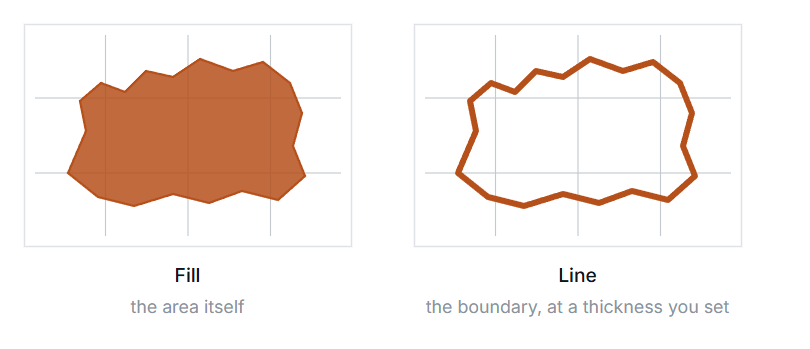
Line options:
Line thickness
In line mode the thickness is yours to set, and the control plugin also carries a minimum and a maximum. Those two are not decoration: they become the bounds of the control an operator is given, so they are how you stop a hairline that disappears on air or a slab that swamps the map. Set them to the range you are happy to see broadcast.
Revealing a line
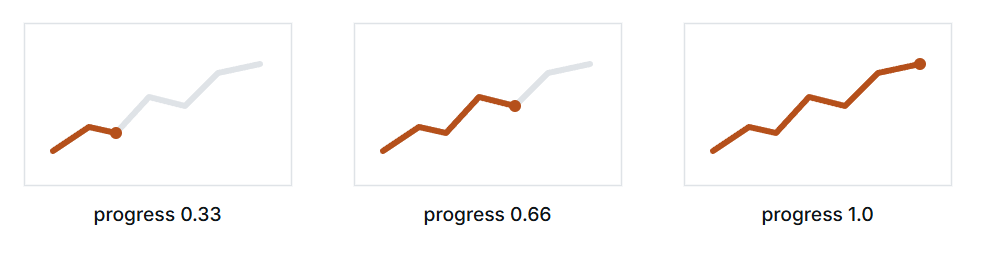
A line does not have to appear all at once. Two settings turn a route into an animation: progress, how much of the line is drawn, and start offset, where the drawing begins.
Antimeridian Settings
The line at 180 degrees, where longitude wraps from east to west, is where shape data traditionally breaks. A route from Tokyo to Los Angeles crosses it; so does anything covering the Pacific, Fiji, New Zealand's outer islands or Russia.
The difficulty is that a shape spanning the line has coordinates at both extremes — some near 179, some near -179. Read naively, the shortest path between those two numbers goes the wrong way round the planet, and what should be a short hop across the Pacific becomes a band stretched across the entire map.
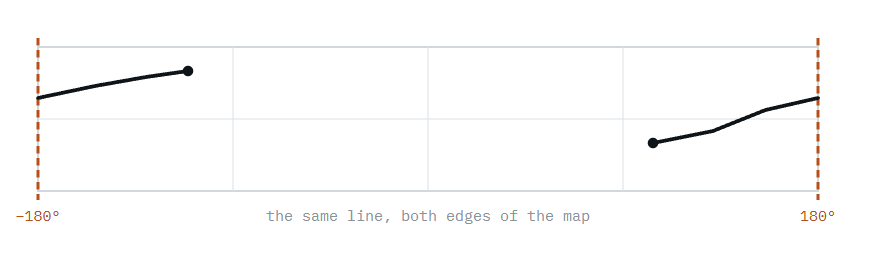
How data expresses a crossing
Publishers solve this in three different ways, and which one you have decides what you should do about it. At import time, we do not know how the data is structured, it can be one of the following:
In the data | Looks like |
|---|---|
Natural wrap | Coordinates stay within −180 to 180 and simply jump: |
Extended coordinates | Longitude is allowed past the limit: |
Split at the meridian | The shape is already cut in two, as the standard prescribes: an eastern piece from |
The GeoJSON node has an antimeridian mode with three settings, which decide what the engine does with the coordinates it was handed.
None | Takes the coordinates exactly as given, without interpretation. | The data is already correct for how you want it drawn — typically a properly split dataset. Start here. |
Normalize | Brings coordinates back into the standard −180 to 180 range. | The file uses extended coordinates that run past the limit, and you want them folded onto the map normally. |
Split | Cuts shapes at the meridian into separate pieces either side. | A shape spans the line as one piece and is drawing as a band across the world. This is the repair. |
Leave it on None and look. Most datasets are fine, and a Pacific one that draws correctly needs nothing. If a shape distorts across the map, try Split. If a shape is missing or is drawn far off the edge of the world, its coordinates run past 180 — try Normalize. It takes seconds to try all three, and the right one is obvious on screen.
The setting has no effect on data that never approaches 180 degrees - Therefore an European or American dataset will look identical in all three modes. Judge it on the Pacific, not on the shape you happen to have open.