Projections
The Earth is round and your screen is flat. A projection is a method that turns the location on Earth, given by latitude and longitude, into positions on a flat map.
Every projection distorts. That is not a flaw of a particular projection; it is a mathematical assurance. Because a sphere cannot be flattened without stretching something. A projection lets you choose which property survives: shape, area, distance or direction. You get to keep some and you must give up others.
Viz Engine offers the most common ones and the choice is usually obvious once you know what each retains.
Mercator
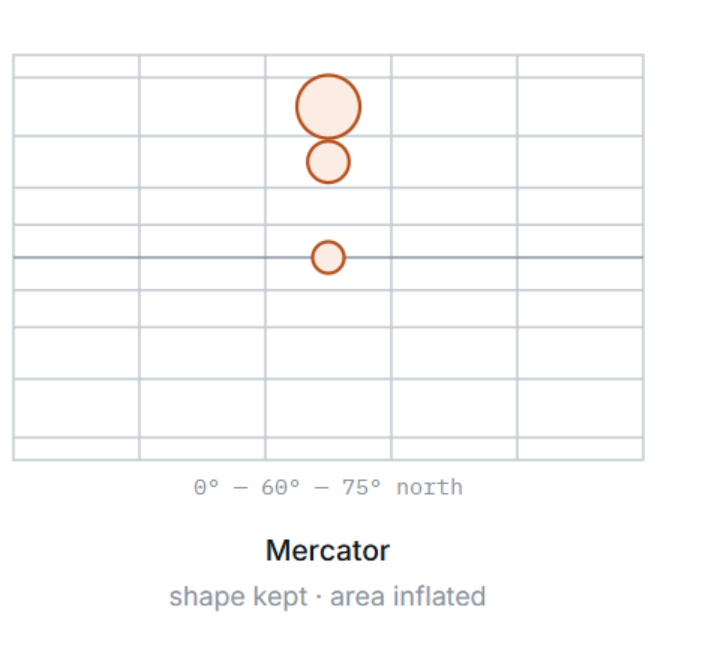
The projection every web map uses, and the default here. Meridians are straight, evenly spaced vertical lines; Parallels are straight horizontal lines that spread further apart the closer you get to the poles.
That spreading is deliberate. It is exactly the amount needed to keep shapes correct: a bay, a lake or a city block has the right form and angles, and north is straight up everywhere on the map. This is why it feels natural to navigate — you can turn, zoom and read a street layout without anything looking bent.
The price is area. Distance from the equator inflates things dramatically: Greenland appears roughly the size of Africa, when it is about a fourteenth of it. The poles themselves are infinitely far away in the mathematics, so the map is cut off a little beyond 85° — the Arctic and Antarctic simply are not there.
There is a practical reason it dominates. Mercator makes the world a square that divides neatly and repeatedly into four, which is what makes tiling and zooming work at all. That is the subject of the next-but-one section, and it is why imagery on the backend is organized this way.
Choose Mercator for
Anything the audience navigates: cities, streets, a push into a location.
Anything where shape carries the meaning — a coastline, a stadium, a border.
Any map where the viewer's instinct is a phone map, which is most of them.
Equirectangular
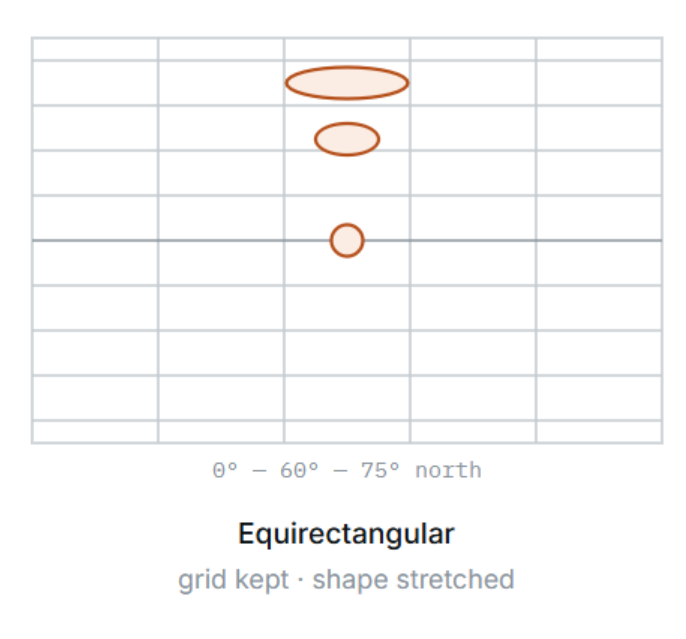
The simplest projection is: longitude becomes the horizontal position and latitude becomes the vertical position, with nothing else applied. One degree is the same number of pixels everywhere, so the grid is a plain, even grid of squares.
That evenness is its strength. The whole world fits in a clean two-to-one rectangle, the poles are included rather than cut off, and any data expressed in degrees maps onto it without arithmetic.
The cost is shape. Because the meridians stay parallel instead of converging as they do on the globe, everything is stretched horizontally as you move away from the equator — increasingly so toward the poles, where a small area becomes a wide smear. Near the equator the two projections look almost identical; at high latitude they look nothing alike.
Choose equirectangular for
Whole-world graphics where you want the entire globe in one clean rectangle.
Anything that has to include the polar regions.
Overlays and datasets already expressed as a plain latitude/longitude grid.
Equal Earth
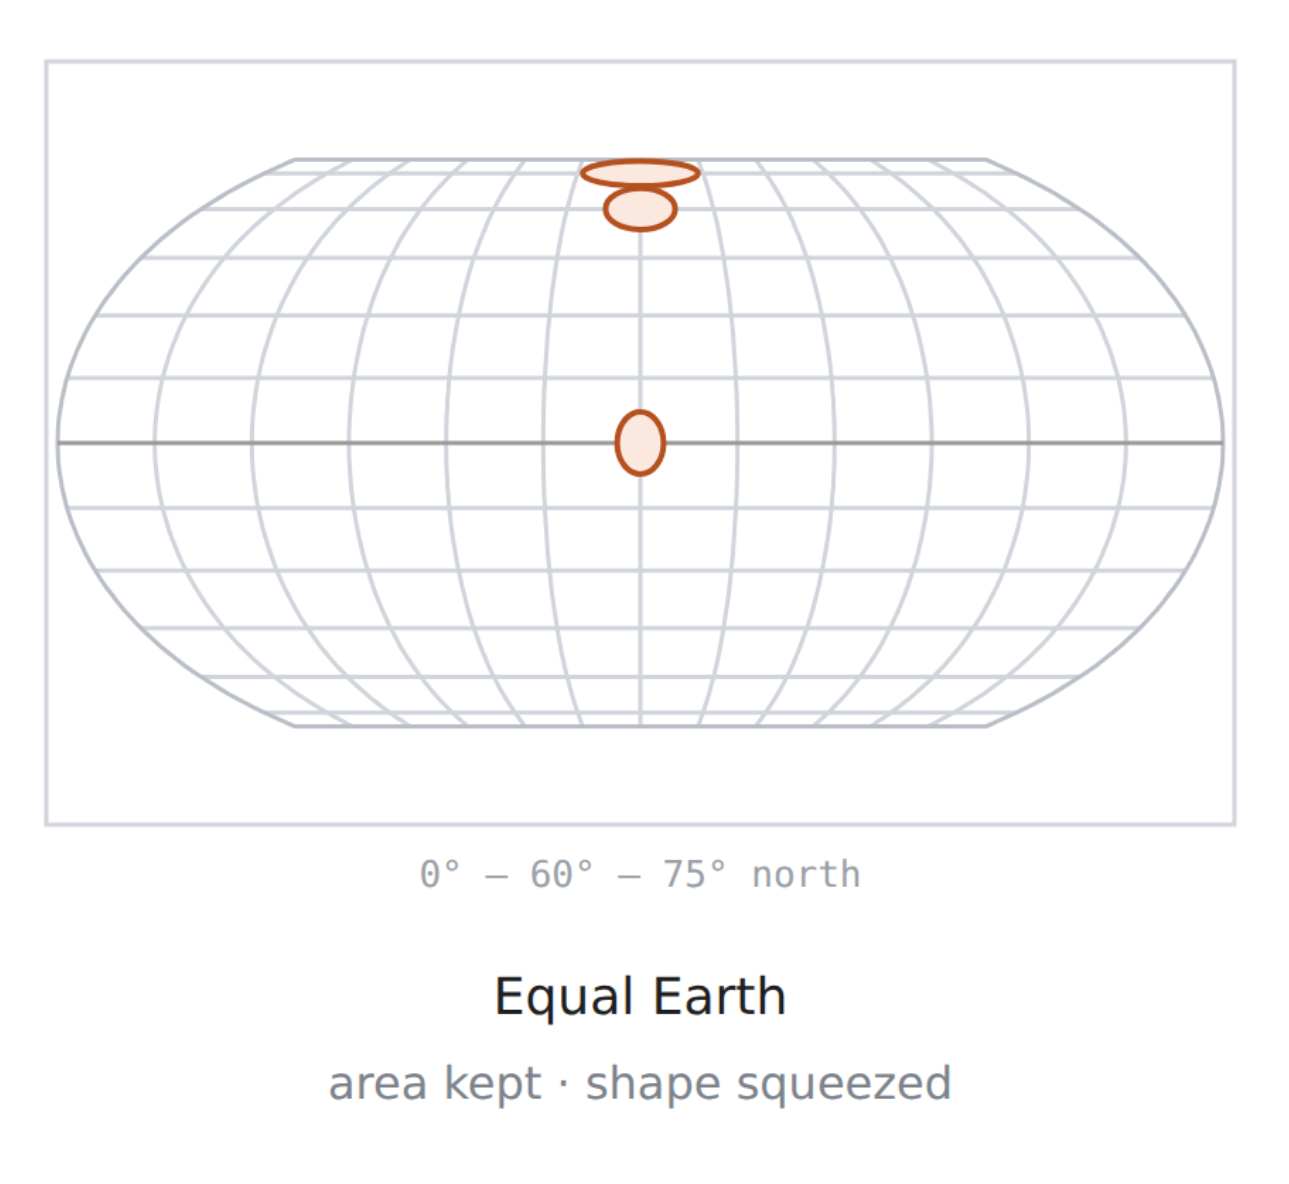
Equal Earth is an equal-area projection. Every region keeps its true size relative to the others, so Greenland appears at its real size next to Africa, not inflated as on Mercator. Parallels are straight horizontal lines, which keeps latitude easy to read. Meridians curve gently toward flat poles, giving the map its rounded outline. To keep area constant, shapes get squeezed toward the poles: features are flattened vertically and stretched horizontally, and this grows with latitude. Near the equator the distortion is small.
Use it for world maps where comparing sizes matters, such as data-driven thematic maps, global overviews and weather or climate graphics.
Choose equal earth for
Comparing sizes matters. Showing country areas, population density or regional coverage without Mercator's inflation near the poles.
You're mapping data on a world map. Choropleths, heat maps, climate or weather overviews, election results or anything shaded by region. Equal area keeps the shading honest.
You need a full-world overview. It shows the whole globe including the poles and looks natural to viewers.
You want an alternative to Robinson. It looks similar, but it is truly equal-area and simple to compute.
Latitude should be easy to read. Parallels stay straight and horizontal, so north/south comparisons remain clear.
If you are unsure, start with Mercator. It is the default, it matches what the imagery is built for, and it is what viewers expect.
Use Equal Earth for world maps where sizes get compared, Mercator for zoomed-in maps where shapes and angles count, and Equirectangular for maps built directly on imagery.
GeoCanvas and GeoCamera
A map is two things placed on one container. They are easy to confuse and they do quite different jobs.

GeoCanvas — the map surface
This is the map itself: the object that works out which imagery the current view needs, requests it, and draws it. It holds the style, and the settings that decide how eagerly imagery is loaded and how long the map will wait for it.
Source Mask Layer: The GeoCanvas can automatically create a Source mask for you. This is the same Mask as you would use it with MaskSource/MaskTarget plugins. Use it to cut off anything that goes outside your map.

GeoCamera — the view
This decides which part of the world you are looking at and from what angle: latitude, longitude, zoom, bearing, pitch and projection.
The scene camera frames the map inside your shot — how big it is, where it sits on screen. The GeoCamera flies over the Earth. If you are moving the scene camera to reach another country, you are using the wrong one. If your map is the wrong size in frame, that is the scene camera and not a maps problem at all.
Tip:
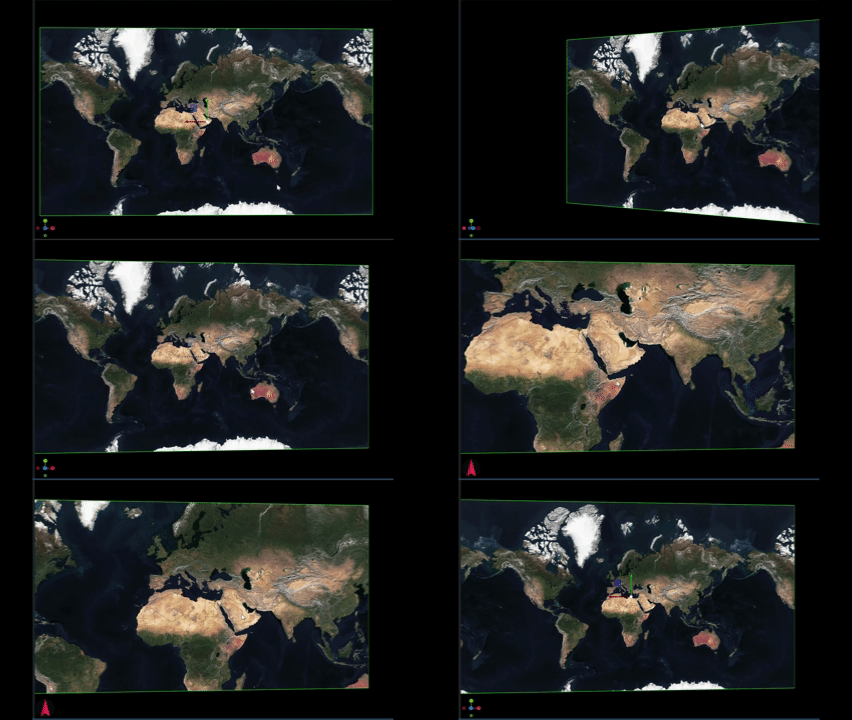
press the “M” key (for Map) to directly navigate inside a Map canvas. Use your mouse to change the latitude and longitude, the wheel to change the zoom level.
Notice the camera widget on the lower left will change to a Navigation Arrow instead of the xyz widget.
Geo Transformation
To allow for easier navigation and placing objects based on coordinates, there is a new transformation mode introduced, Geo Transformation.
Click on a container's transformation icon to switch to GeoTransformation:
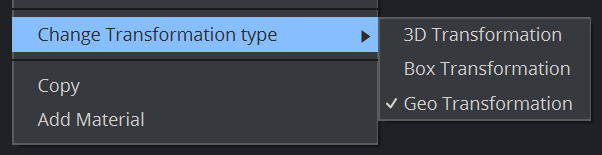
Every container underneath a GeoCanvas will use this container as a Basemap. Anything you put on the map - a pin, a label, a shape - will be positioned geographically rather than in scene space. A container placed the ordinary way sits at a fixed point in the scene while the map slides underneath it. A container given a geographic position belongs to a place on Earth and travels with the map.
Example:
Let's do a simple example: Create a new container and add the GeoCanvas to it, the GeoCam is added automatically. Choose a style, the map appears.
Create a sub container and switch to Geo Transformation, add a simple geometry to it:
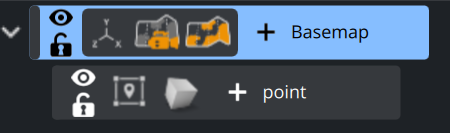
Now clicking on the Geo Transformation of the point container will show you several options:
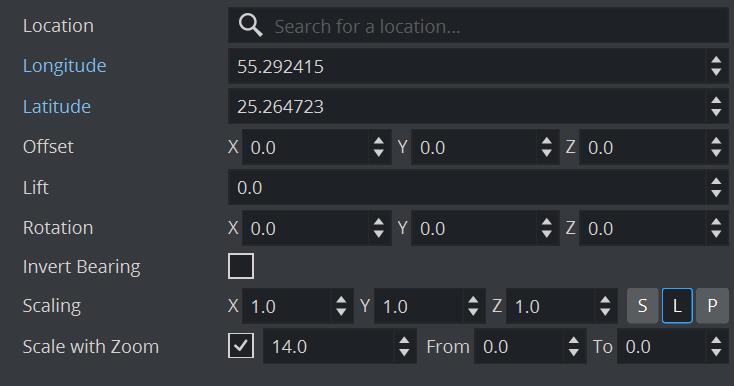
Inside Location, you can search for almost any point of interest, let's choose Dubai. Once selected, Longitude and Latitude will be filled in automatically and our point now sits at the Dubai location in the UAE.
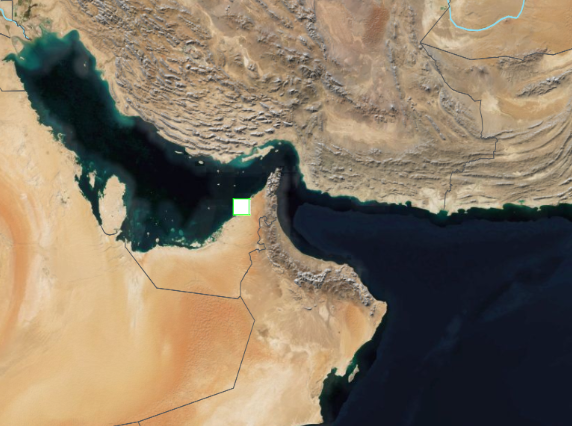
To check if everything works correctly, fly the GeoCamera to another continent. Everything anchored properly leaves the frame along with the ground it belongs to. Anything still sitting in the middle of the screen was never given a geographic position.
There are several more options inside the GeoTransformation:
Row | What it does |
|---|---|
Location | A search box. Type a place name and the coordinates below are filled in for you — the quickest way to pin something without looking numbers up. |
Longitude | East–west position, −180 to 180. Note that it comes first in this panel. |
Latitude | North–south position, −90 to 90. |
Offset | A nudge in X, Y and Z away from the anchor point once it has been placed. For fine adjustment — moving a label clear of the pin it belongs to, for instance. |
Lift | Raises the object off the map surface, so it does not sink into the map or flicker against it. |
Rotation | Turns the object on X, Y and Z, on top of whatever the map is doing. |
Invert Bearing | Keeps the object upright while the map rotates beneath it. Switch it on for anything carrying text. |
Scaling | The object's size in X, Y and Z. |
Lift and Offset are not the same thing
Both shift an object from the position given by its coordinates, but they do so for different reasons.
Lift adds a small amount of height, making the object sit on top of the map rather than inside it.
Offset is a visual adjustment that moves an element slightly to make the overall arrangement clearer
Reach for Lift when something is disappearing into the ground, and Offset when something is in the wrong place relative to its neighbors.
Scale with Zoom
This single row decides how an object behaves as you fly in and out, and it carries three values.
The checkbox. Off, the object stays the same size on screen at every zoom. On, it grows and shrinks with the map, like something drawn on the ground.
The zoom value beside it is the zoom level at which the object appears at exactly the size set under Scaling. Above that level it is larger, below it smaller.
From and To set the limits for scaling. Inside the range the object scales with the map; outside it, the size holds. This avoids markers becoming oversized at high zoom levels or disappearing at low ones.
A city pin or a label has to stay readable at any zoom — leave Scale with Zoom off. Something that represents real ground, like a stadium footprint or a flood area, should grow with the map — switch it on, set the zoom value to the level you designed it at, and give it a From/To range so it stays sensible at both extremes.
Quick Map Guide:
Make a container for the map - One container at the top of the scene tree. This container is the map — everything you place on the map later goes underneath it, which is what lets those things move with it.
Add the GeoCanvas and the GeoCamera - Both go on the container. Nothing appears yet: the map has no style, so there is nothing for it to draw. That blank state is expected.
Choose a style - Set the style to one your backend publishes — Satellite is a good first choice because it is unmistakable when it works. Imagery should begin arriving.
Frame it with the scene camera - The map renders in the scene like everything else, so the scene camera decides how much of the shot it fills. Adjust it until the map sits in frame the way you want. You should not need to touch this again.
Fly it with the GeoCamera - Set latitude, longitude and zoom for your first location — try
40.7128,−74.0060at zoom 12 for New York. Get the position right before adding bearing and pitch, so you always know which control caused what.
Animating GeoTransformation
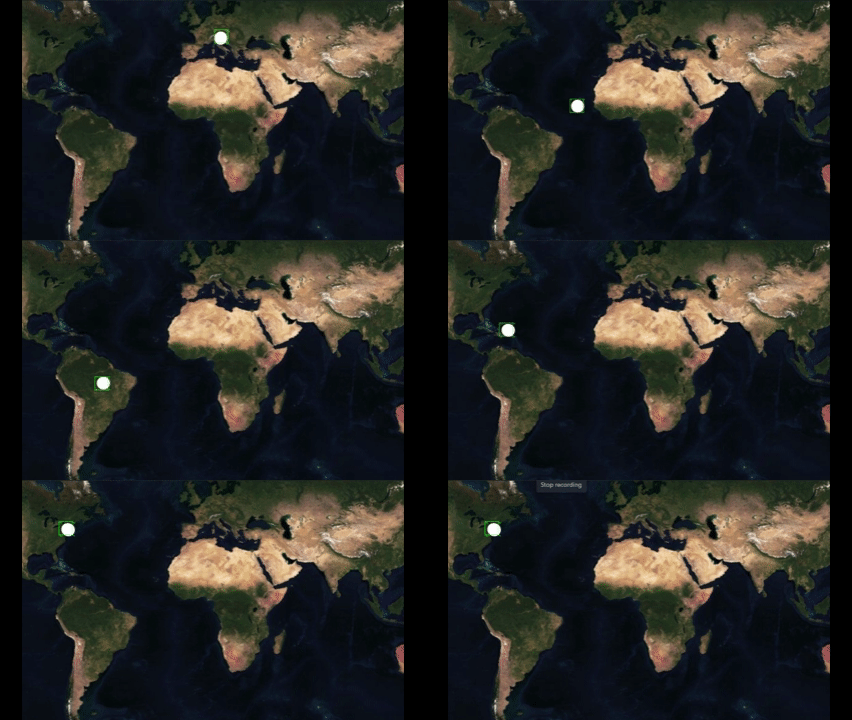
GeoTransformation parameters can be animated.
If you need to quickly animate a flight from Vienna to Brazil to New York, simply type in the locations, hit the Set Key frame and you're done.
Caching and Optimizations
How tiling works
The map is not one enormous image that gets scaled. If it were, the whole world at street detail would be far larger than any machine could hold. Instead the imagery is pre-cut into small squares called tiles, at many levels of detail, and the engine fetches only the handful that cover what you are actually looking at.
The pyramid
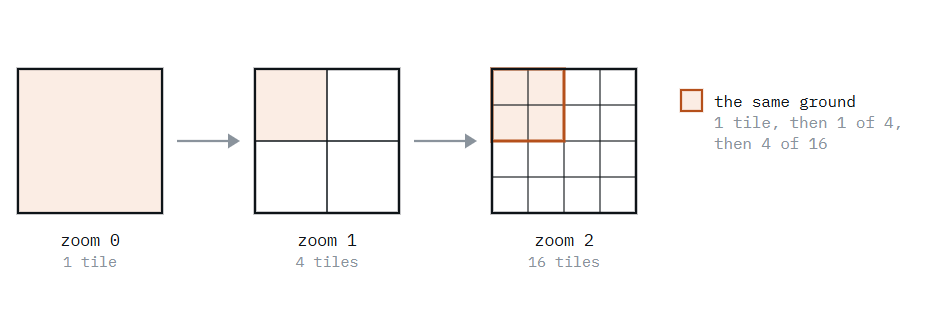
Level 0 is the entire world in a single tile. Each level down splits every tile into four, so there is twice the detail in each direction. Level 1 is 4 tiles, level 2 is 16, and so on — by level 12 the world is more than sixteen million tiles, which is why nothing but the visible ones is ever requested.
Two kinds of tile
Some tiles arrive as finished pictures — satellite photography, for instance, which can only be an image. Others arrive as compact descriptions of what is there: this road, that river, this place name. The engine draws those itself using the style.
That difference explains two things you will notice. Labels and roads stay crisp when you zoom, because they are being drawn at your screen resolution rather than enlarged from a picture. And the same underlying data can look completely different under two styles, because the style is doing the drawing.
Where detail runs out
Each source of imagery covers a range of zoom levels, and they are not all the same. Photographic imagery over a city may go very deep while a specialist layer starts only at a middling zoom. Push past what exists for a remote area and the map stops getting sharper — that is the data ending, not a fault in your scene.
How caching works
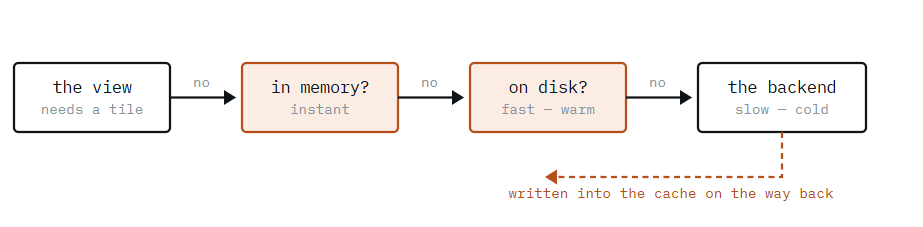
Every tile the engine fetches is kept in a local cache on the machine. The next time you look at the same place at the same zoom, it comes off the disk instead of the network — which is why a map you have already viewed appears instantly, and one you have never viewed takes a moment.
This is the single most important thing to understand before you go on air: a map you have rehearsed is not in the same state as a map nobody has opened yet.
Cold and warm
A cold view is one whose tiles are not cached: a location nobody has visited on this machine, a style just switched to, or a zoom level not yet used. It needs the network. A warm view is already on disk and needs nothing.
If your map design is part of a playlist element, this is handled by the control application during initialization, the essential step before playing out elements.
Otherwise, fly the map through the places and zoom levels you will use on air. This fills the cache, so the on-air move is a warm one. Treat it like preloading clips.
Ready
The map reports whether it has everything it needs for the current view. Anything that captures or hands over the picture — a snapshot, a transition, a take — should wait for that rather than a fixed pause, because how long it takes depends on the network and on what is already cached.
There is also a tile ready timeout: the longest the map will wait for imagery before drawing what it has. Raise it for slow connections or deep cold zooms; a map that goes on air half-drawn usually needs a longer timeout, not a longer sleep.
Prefetching
The map can fetch more than the view strictly needs, so the next move is already warm.
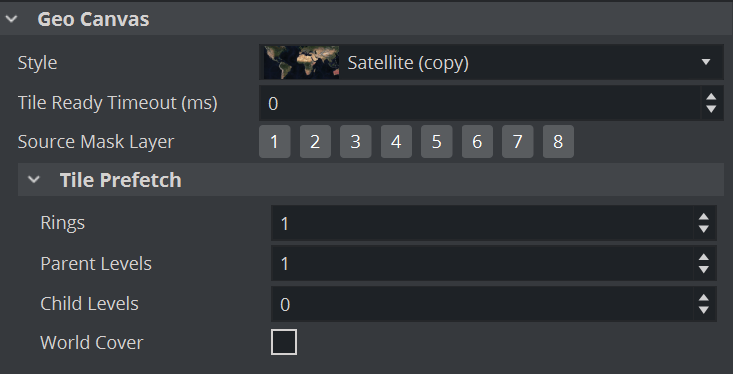
Three settings control how much:
Prefetch settings | ||
Setting | Fetches ahead | Helps with |
|---|---|---|
Rings | Tiles around the edge of the view | Panning — moving sideways across the map. |
Child levels | Levels below the current zoom | Zooming in. |
Parent levels | Levels above the current zoom | Zooming out. |
Be aware, every child level counts times 4, keep this number low otherwise it will exponentially increase your cache size.
All three cost network traffic and cache space, so they are off by default. Turn on the one that matches the move you are about to make: rings for a pan, child levels for a push in. Prefetching is an optimisation — it makes a move more likely to be smooth, it does not guarantee it.
What prefetching is not
It improves the odds that a move is smooth; it does not guarantee it. On a cold machine with a slow link, a fast move can still outrun the imagery. Prefetching plus a rehearsed cache is reliable — prefetching alone is not.