Tracking Hub Administrator Guide
Version 1.4 | Published October 30, 2020 ©
Data Flow Inspector
The Data Flow Inspector allows the user to visually monitor the incoming and outgoing tracking data to prove its quality. Errors within the actual received and transmitted values can easily be spotted.
Viz Studio Manager provides two different kind of data services:
-
The tracking systems raw data values monitor the genuine incoming data sent from the tracking system.
-
The final outgoing tracking data sent to the Engine includes the rig transformations and all the offsets set up within Tracking Hub.
To Activate Monitoring
To be able to see the tracking data values in the Data Flow Inspector, a service must be set up which forwards the packages.
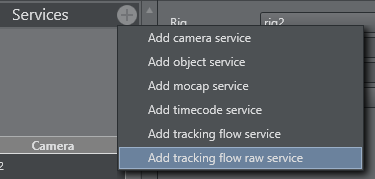
Raw Data
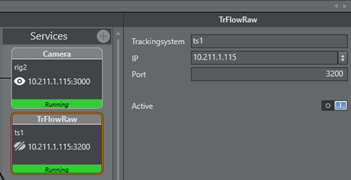
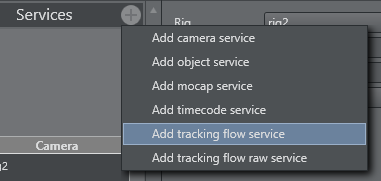
A new tracking flow raw service needs to be added.
-
Trackingsystem: Name of the tracking system node which should be monitored.
-
IP: IP address of the machine where the data flow inspector is running (typically the local machine address).
-
Port: Default Port is set to 3200.
-
Active: Turns service on or off.
Rig Data (Final Transformation)
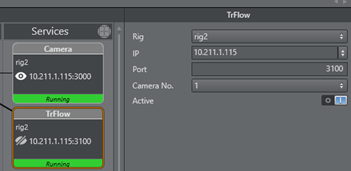
A new tracking flow service needs to be added.
-
Rig: Name of the rig node which should be monitored.
-
IP: IP address of the machine where the data flow inspector is running (typically the local machine address).
-
Port: Default Port is set to 3100, can be changed in the Data Flow Inspector.
-
Camera No.: Camera ID of the virtual camera.
-
Active: Turns service on or off.
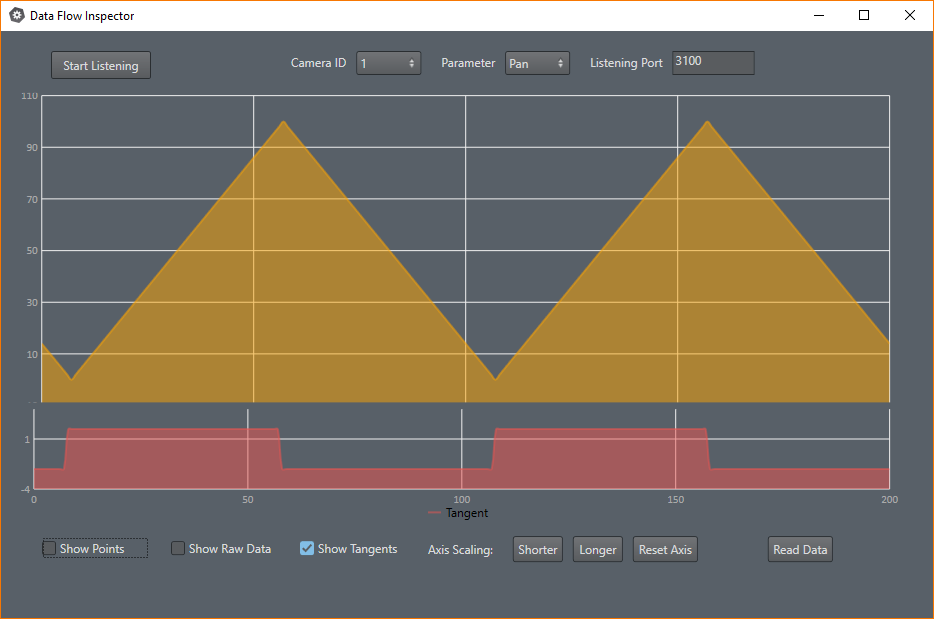
After the services are running the Data Flow Inspector can be started.

-
Start Listening: Starts receiving incoming tracking data. As soon as data is detected, it is added to the graph.
-
Stop Listening: Stops receiving data.
-
Camera ID: Sets the ID for the virtual camera used for receiving data. This especially is needed when multiple data packages are send to the same recipient.
-
Parameter: Defines which parameter of the tracking data should be prompted on the graph.
Tracking Flow Inspector supports 18 different parameters sent from Tracking Hub to Engines.
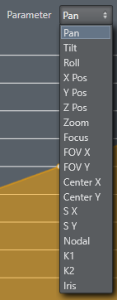
Raw data values do not support all 18 parameters. Available options are: Pan, Tilt, Roll, PosX, PosY, PosZ, Zoom and Focus.
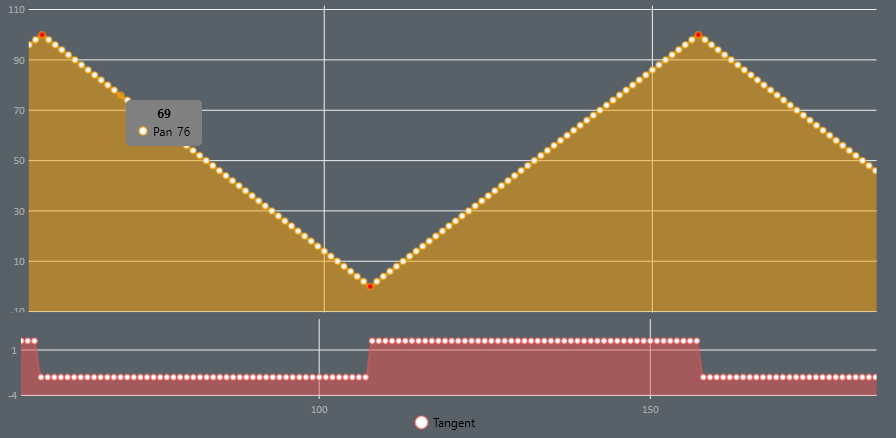
Tangent Curve
The tangent curve represents the slope between every point. Strong changes within this curve indicate that the difference between points is high and therefore probably not following smooth and realistic values. This curve can be enabled/disabled on the bottom menu.
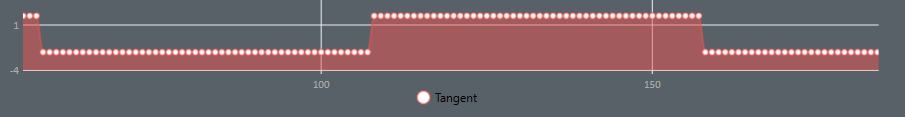
Below is an example of tracking data coming in in a perfect ramp, the tangent clearly shows the change in direction of the tracking data values.
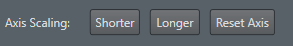
Axis Scaling
The scaling of the axis can be changed to give a better overview of the currently represented data. the button menu at the bottom defines the amount of data packets recorded by the graph at a time.
By default, 200 packets (data values) are represented in the graph.
-
Shorter: Decreases axis scaling range.
-
Longer: Increases axis scaling range.
-
Reset Axis: Resets the axis scaling range to default (200 packets).
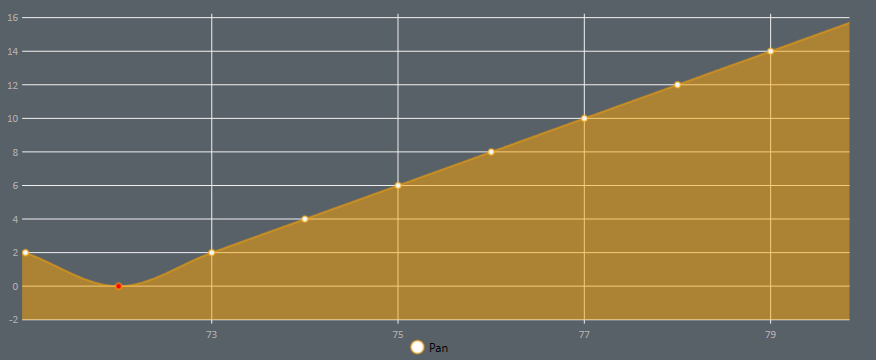
Zooming
The mouse wheel can be used to zoom in or out of the graph to get a closer look at the values between the points.
-
Show Raw Data: Switches to show the raw data. A raw data service has to be active in Studio Manager.
-
Show Points: Draws the points onto the graph for reading the precise value. Having to many points drawn (longer axis range) results in slowing down the graph.
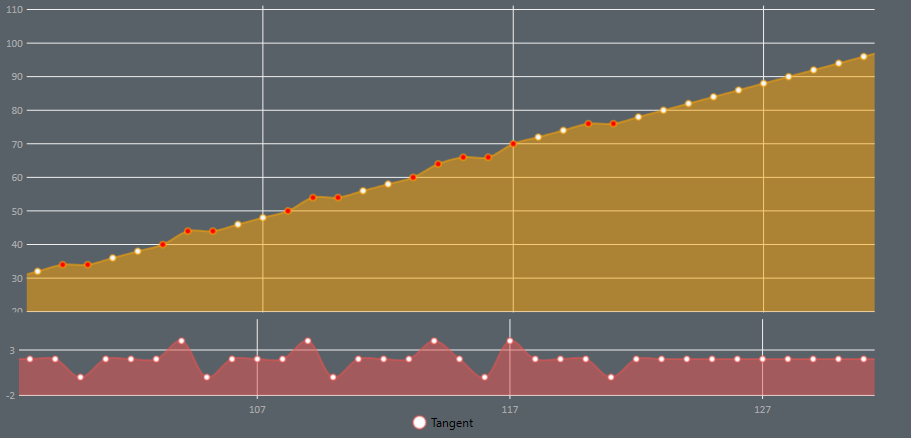
Red Points do indicate possible errors in the data. This means that the average difference between two following points is probably too high.
Warning: Red points are intended as a help and do not show definite errors. While a strong change in direction between points is highly unlikely, it is no guarantee that the packet is actually wrong.