
Tracking Hub Administrator Guide
Version 1.4 | Published October 30, 2020 ©
Timing Analysis Window
The Timing Analysis Window can be opened by clicking the View Timing Analysis button in the Configuration Panel. The Timing Analysis Panel contains two tabs: Tracking and Engine.
-
 : Starts or pauses the timing analysis.
 -
 : Refreshes the data.
The Tracking tab analyzes tracking systems and camera services. In the top half of the panel, timing events are displayed in form of one timing track per tracking system and camera service. The timing events between the latest two sync signals are displayed (i.e. the length of the timing tracks is determined by the studio frequency).
The sync signals are represented by orange circles. The next-to-last sync signal rests at the left border of each track, without moving. The latest sync signal may flicker at the right border, and may even be temporarily out of sight, because of timing variations.
-
A blue bar represents the time needed to receive tracking data.
-
A purple bar represents the time needed to store the received tracking data.
-
A green bar represents the time needed for computations on the tracking data to be sent next.
-
A red circle marks the moment when Viz Tracking Hub has finished sending the tracking data to the connected Viz Engine(s).
In the lower half of the panel, some of the events are plotted over time. The newest events are displayed at the right border and constantly move towards the left border as time passes. Colors correspond to those in the timing tracks in the top half of the panel.
For a specific tracker, timing analysis can be started right clicking the tracker or selecting Analyze timing in the open context menu. A service is created to send the timing information to the Studio Manager. To stop the service, either close the created service or deselect Analyze timing in the context menu.
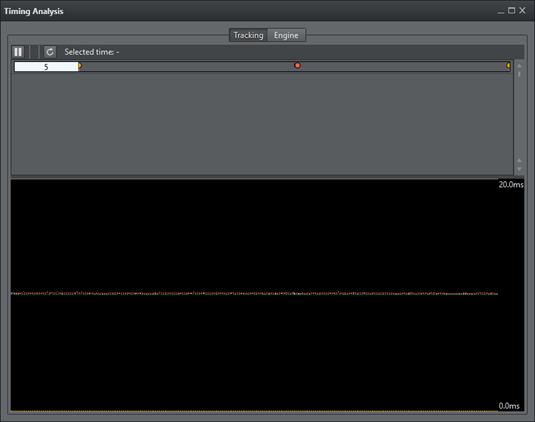
The Engine tab analyzes the timing reported by Viz Engine (requires Viz Engine version 3.8 or later) on the selected network.
-
The blue bar represents the minimum (light blue) and maximum (dark blue) time which passed between two sync signals on the Engine.
-
The start of the red bar is the point in time when the tracking data arrived at the Engine. The end of the red bars indicates the minimum (light red) and maximum (dark red) time between two incoming tracking packages.
See Also