Viz Social User Guide
Version 1.0 | Published June 22, 2021 ©
Overlays
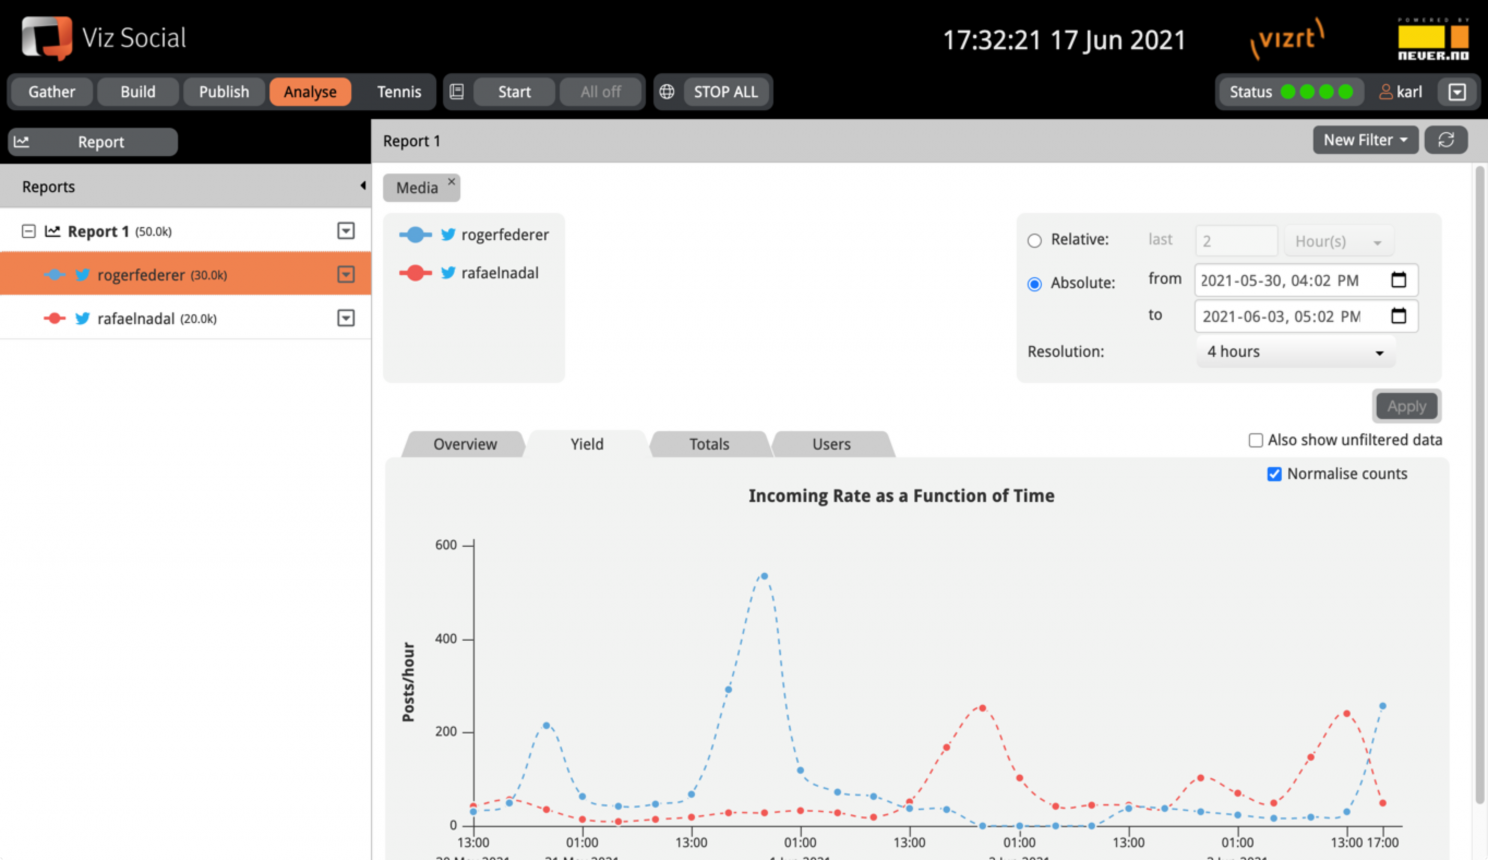
Quite similar to the Views of Carousels, Reports also can be overlaid to also show the evolution of only a specific subset of the data. Multiple of these Views can be setup simultaneously. Views do not impact the bare data itself, so when they are removed the original date of the first Report is shown again.
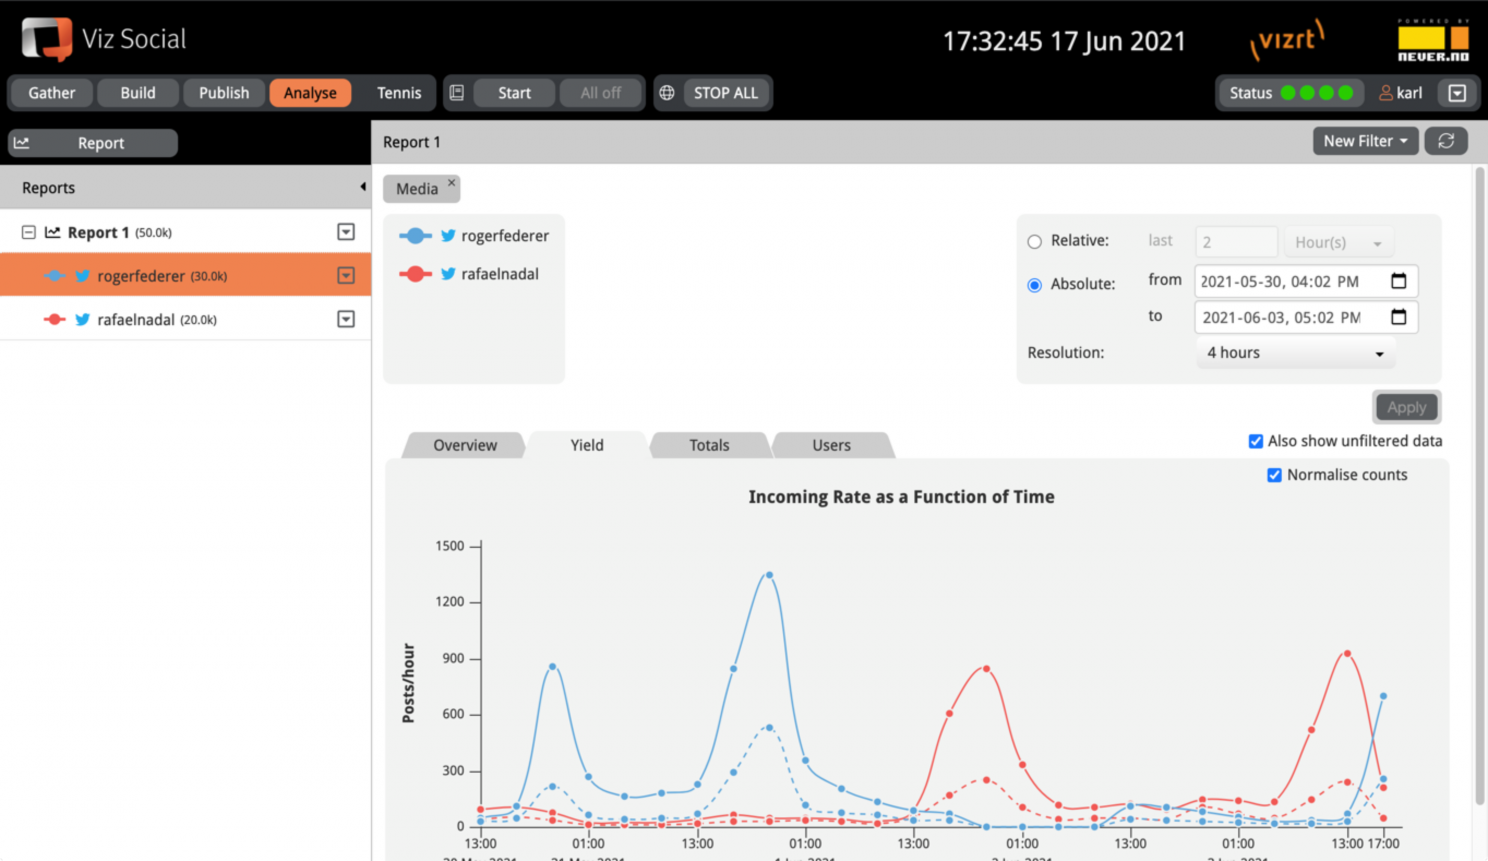
When Views have been set up, the Also show total data checkbox becomes visible directly under the canvas for configuring the time window. When this checkbox has been selected, then for each data set overlaid data and original data are shown simultaneously, so that the effect of the overlay can be seen in a single glance. This works particularly well when selecting individual data sets in the left column.
|
Overlays for Reports |
|
|
|
Displaying Filtered and Unfiltered Data |
|
|