Graphic Hub Administrator Guide
Version 3.1 | Published July 11, 2018 ©
System Status Panel
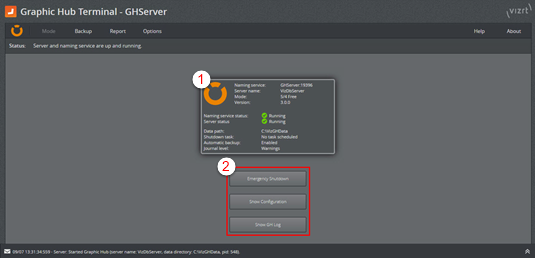
The System Status screen shows the current mode configuration and its menu options.

-
Mode panel (1): Shows the current status of the configured mode:
-
Panel Border Color: The color of the panel border may indicate a warning state when orange. The shadow around the panel indicates the machine the web interface is currently opened on, allowing for quick identification on cluster setups.
-
Naming Service/Server Name/Mode/Version: Information on the current configuration. If the hostname exceeds 20 characters, it will be truncated. However, the tooltip will display the name in its entirety.
-
Naming Service/ServerStatus: Displays current server status.
-
Data Path: Displays the path to the Graphic Hub data directory.
-
Shutdown Task: Displays the status of configured shutdown tasks.
-
Automatic Backup: Displays the status of automatic backup tasks.
-
Journal Level: Displays the current journal level.
-
-
Start Server / Emergency Shutdown (2): The button label and function changes depending on if the Graphic Hub server is running or not. When the server is not running, click the button to start it. When the server is running, a Graphic Hub Emergency Shutdown can be executed by clicking the button.
Warning: An Emergency shutdown will shutdown the server almost immediately. For a controlled shutdown of the server, use the Graphic Hub Manager to shut it down.
-
Show Configuration (2): Open the Graphic Hub Mode Configuration panel.
-
Show GH Log (2): Open the Graphic Hub Server Log panel, which displays the contents of the server log file.
See Also