
Viz Artist User Guide
Version 3.12 | Published October 17, 2019 ©
Area Chart
![]()
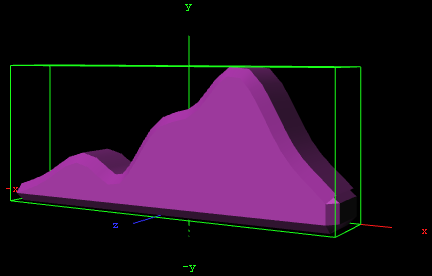
Th Area Chart plug-in draws an area chart, filled with data out of a Shared Memory Map. You can use delimited strings or arrays for data transfer via Scene, Global or Distributed Shared Memory.
Note: This plug-in is located in: Built Ins -> Geom plug-ins -> VisualDataTools
This page contains the following topics and procedures:
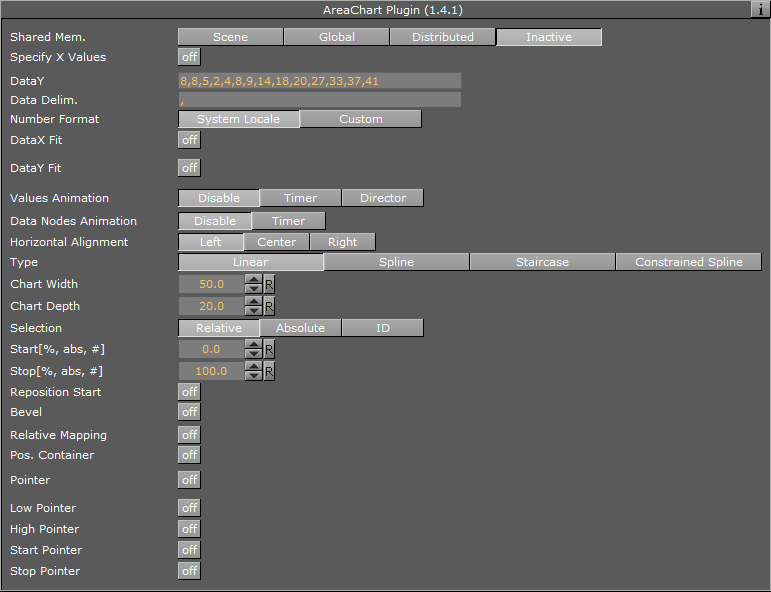
Area Chart Properties
-
Shared Mem.: Changes between Scene, Global and Distributed Shared Memory. Use Inactive memory to not forward any values via Shared Memory.
-
Specify X Values: Enables DataX input.
-
Key DataX: Defines Shared Memory key name for X values.
-
DataX: Defines parameter for X values if Shared Memory is set to Inactive.
-
-
Key DataY: Defines Shared Memory key name for Y values.
-
DataY: Defines parameter for Y values if Shared Memory is set to Inactive.
-
Transfer Mode: Sets string or array based data transfer (not available when set shared memory is set to Inactive).
-
Data Delim.: Defines the value separator sign(s).
-
Number Format: Defines if Viz should get the decimal point separator from the System Locale or Custom settings. If Custom is enabled:
-
Decimal Symbol: Defines which symbol is used as decimal point when Custom Number Format is set.
Note: If the Area Stack plug-in is used, the following Area Chart properties need to be defined in the Area Stack plug-in.
-
-
DataX, Y Fit: Enables data normalization.
-
DataX, Y Scale: Scales input by the selected factor.
-
DataX, Y Offset: Adds an offset to the incoming data.
-
DataX, Y Auto Scale: Enables automatic data normalization.
-
DataX, Y Fit Size:Total: Scales the whole chart to the defined borders. Current scales the current chart segment to the set borders.
-
DataX, Y Detect Limits: Detects minimum and maximum of all values and scales them to adjusted Start and Stop. This option is used to upscale the interesting part of the chart - especially if there are only little changes between the data values.
-
DataX, Y Threshold: Adds a definable offset to the detected limit.
-
DataX, Y Start: Lower Auto Scale edge.
-
DataX, Y Stop: Upper Auto Scale edge.
-
-
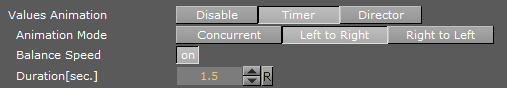
Values Animation: Sets the vertical animation type to be created when data values change, but the number of nodes is still the same.
-
Disable: No animation.
-
Timer: Creates data transition animation (from an old set of data to a new set) within the specified time set in Duration sec. Also select an Animation Mode.
-
Director: Creates data transition animation with the Stage Director, that controls the Animation Progress parameter from 0.0% (old data) to 100.0% (new data). Also select an Animation Mode.
-
-
Animation Mode:
-
Concurrent: Changes all nodes concurrently.
-
Left to Right: Transitions from left to right.
-
Right to Left: Transitions from right to left.
-
-
Balance Speed: Relates node values to the position of transformed data when set to On and Animation Mode is set to Left to Right or Right to Left.
Example: Balance Speed: If the values of four nodes change from 0,0,0,0 to 1,9,90,900 in Left to Right mode at 50% of the transformation. Balance Speed Off: Only the first two nodes are transformed to new values. Balance Speed On: The first three nodes are already transformed to new values, and the last node also transformed to 44% of the new values, because the data change from 0 (0+0+0+0) to 1000 (1+9+90+900), at 50% of transformation (in this case the values is changed for 500 of 1000), the first 3 nodes are already finished and the last node is changed to 400.
-
Duration sec.: Sets the duration of the animation in seconds for Timer mode.
-
Data Nodes Animation: Sets the horizontal animation type to be created when number of data nodes change is detected.
![]()
-
Disable: No animation.
-
Timer: Creates data transition animation (from an old set of data to a new set) within the specified time set in Duration sec.
-
Duration sec.: Sets the duration of the animation in seconds for Timer mode.
When number of nodes is changes, area chart looks for added and removed nodes from their values, adds new nodes to the chart from zero width and resizes all nodes to their new size, specified in duration.
-
-
Horizontal Alignment: Sets horizontal orientation to left, center or right.
-
Type: Creates different graph looks. Available options are Normal, Spline, Staircase and Constrained Spline.
-
Normal: Enables direct connections between entered values.
-
Spline: Interpolates extra values to chamfer the graph.
-
Staircase: Creates a staircase look.
-
Constrained Spline: Same as Spline mode but with a different algorithm to prevent overshooting.
-
-
Stair Width: Defines width for a single stair or for all stairs if Specify X Values is activated.
-
Chart Width: Adjusts the chart width.
-
Chart Depth: Adjusts extrusion.
-
Tesselation Width: Sets tessellation in Spline mode.
-
-
Selection: Specifies Start and Stop type.
-
Relative: 0%: 100%
-
Absolute: Depends on the specified data.
-
ID: Value ID starting from 0.
-
-
Start%, abs,: Graph starting point.
-
Stop%, abs,: Graph stopping point.
-
Reposition Start: Translates the whole chart always to the same starting point independent of varying Start and Stop positions.
-
Bevel: Activates Bevel mode.
-
Bevel Bottom: Chamfers the chart’s bottom
-
Bevel Size: Adjusts bevel’s size
-
Bevel Steps: Sets roundness via the number of segmentation steps
Note: A chamfer is a beveled edge connecting two surfaces.
-
-
RelativeMapping: Stretches texture to fit graph width.
-
Pos. Container: Translates every child container to a bar’s top.
-
Container Offset: Adds a certain offset to each container.
-
Container Offset Z: Adds a Z Axis offset to each container.
-
Center Container: Centers each translated container.
-
-
Pointers Shared Mem.: Selects the map where the pointer values should be distributed to.
-
Key Data Pointers: Defines Shared Memory Keyname.
-
Pointer: Activates the Pointer.
-
Container: Defines Container which should be used as pointer.
-
Selection: Selects the navigation type.
-
Position%, abs,: Sets pointer position in dependency of the selected navigation type.
-
Offset: Defines pointer offset from the chart.
-
Normal Offset: Rotates offset to the direction of the current surface normal.
-
Rotate: Rotates the pointer to the direction of the current surface normal.
-
Offset Z: Adds an additional Z offset to the pointer container.
-
Center Container: Centers Container - useful for varying pointer sizes.
-
-
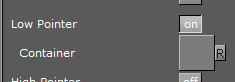
Pointers: Activates each pointer as required:
-
Low Pointer / High Pointer / Start Pointer / Stop Pointer
-
Container: Selects a container for the pointer.
-
To Create a Scene with Area Chart
-
Create a new Container.
-
Add the Area Chart plug-in.
-
Open the Transformation Editor.
Set these parameters:
-
Position X: -100.0.
-
Position Y: -100.0.
-
Rotation Y: -25.0.
-
-
Add a Material and/or a Texture.
-
Open the Area Chart editor.
-
Enter these parameters:
-
Set DataY values: 10,20,30,20,50,60,80,45,20.
-
Set Type to Spline.
-
Set Chart Width to 200.0.
-
Set Chart Depth to 30.0.
-
To Create a Scene with Area Chart and Data Storage
-
Create a new Container.
-
Add the Area Chart plug-in.
-
Add the Data Storage plug-in to Area Chart Container.
-
Select the Area Chart plug-in.
-
Set SharedMem. to Scene.
-
Rename the Key DataY to MyDataY.
-
-
Open the Data Storage editor.
-
Enter MyDataY in the Key Data1 field.
-
Set the SharedMem. to Scene.
-
In Data1 enter: 10,40,50,20,80,90,60,50.
-
To Create a Area Chart with Data Animation
Chart Animation Using Data Import
The following steps are to prepare data sets for animation in Excel file.
-
Start Microsoft Excel.
-
Enter ExcelData1 into cell A1.
-
Add some sample values in the cells below (A2-A8: 80, 35, 45, 75, 85, 55, 60).
-
Enter ExcelData2 into cell A2.
-
Add some sample values in the cells below (B2-B9: 80, 35, 45, 75, 40, 85, 55, 60).
-
Enter ExcelData3 into cell A3.
-
Add some sample values in the cells below (C2-C9: 40, 60, 75, 85, 80, 55, 45, 35).
-
Enter ExcelData4 into cell A4.
-
Add some sample values in the cells below (D2-D8: 60, 75, 85, 80, 55, 45, 35).
-
Rename this first sheet to MyTable (can be done with a double click on the sheet name at the bottom).
-
Follow one of the following methods to make Viz Engine can read this Excel data file:
-
Save and close the Excel document.
-
Share the Excel document.
-
On the Review tab, in the Changes group, click the Share Workbook button.
-
The Share Workbook dialog box appears, and you select the Allow changes by more than one user at the same time. check box on the Editing tab.
-
Click Ok button of the dialog.
-
Save the Excel document.
-
-
IMPORTANT! You must use the same platform (x64 / x86) of Microsoft Excel and Viz Engine.
After the data sets are created, the following steps are to create a Data Animation scene.
-
Follow the "To create a Area Chart" instruction.
-
Modify the following parameters of Area Chart plug-in.
-
Change Shared Mem. to Scene.
-
Set Kay DataY to DataY.
-
Set Data Delim. to #.
-
Set Values Animation to Timer.
-
Set Data Nodes Animation to Timer.
-
-
Add Data Import plug-in into the same container.
-
Set File to above prepared Excel file.
-
Set Table / Sheet to MyTable.
-
Set Column(,Col...) to ExcelData1.
-
Set Data Delim. to #.
-
Set Shared Mem. to Scene.
-
Set Key to DataY.
-
-
Click the GetIt button and animation chart shows from zero to seven nodes.
-
Add one data node in the middle of chart.
-
Set Column(,Col...) to ExcelData2.
-
Click the GetIt button.
-
-
Change values of eight data nodes.
-
Set Column(,Col...) to ExcelData3.
-
Click the GetIt button.
-
-
Remove the first data node.
-
Set Column(,Col...) to ExcelData4.
-
Click the GetIt button.
-
Note: You can add more data columns and play with animation on data change.
Chart Animation Using Control Chart
-
Follow the "To create a Area Chart" instruction.
-
Modify the following parameters of Area Chart plug-in.
-
Set Values Animation to Timer.
-
Set Data Nodes Animation to Timer.
-
-
Add Control Chart plug-in into the same container and save the scene.
-
Open Viz Trio.
-
Import the scene.
-
Click "1 (AreaChart)" in Tab Fields.
-
Edit values in Editing Template.
-
See Also