
Viz Artist User Guide
Version 3.12 | Published October 17, 2019 ©
Stock Chart
![]()
This plug-in draws a stock chart, filled with data out of a Shared Memory Map. You can use delimited strings or arrays for data transfer via Scene-, Global- or Distributed-Shared Memory.
Note: This plug-in is located in: Built Ins -> Geom plug-ins -> VisualDataTools
This page contains the following topics and procedures:
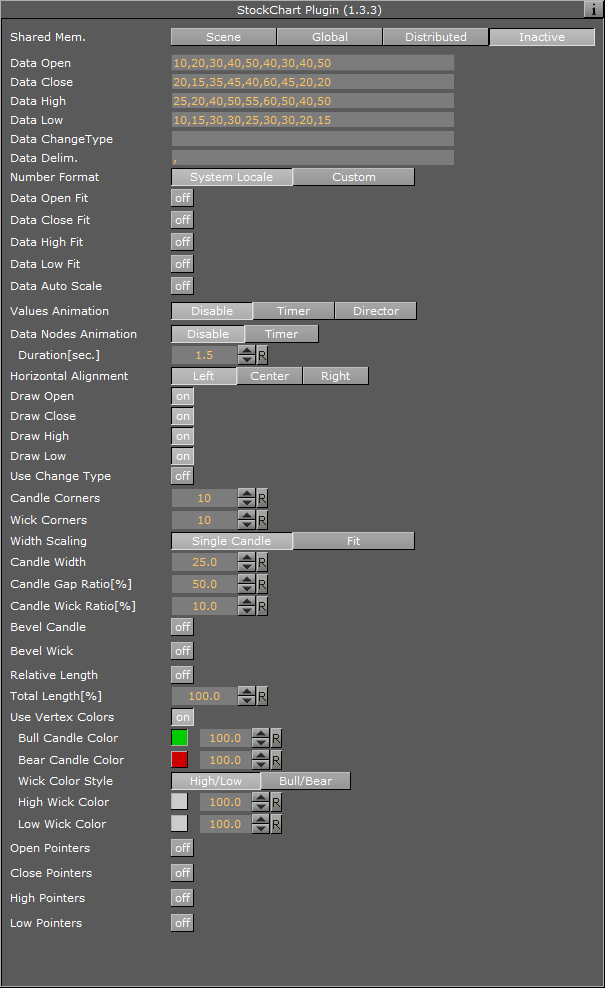
Stock Chart Properties
-
Shared Mem.: Changes between Scene-, Global- and Distributed-Shared Memory. Use Inactive memory to not forward any values via Shared Memory.
-
Key Open: Determines Shared Memory key name for open values. DataOpen is the default input parameter for open values.
-
Key Close: Determines Shared Memory key name for close values. DataClose is the default input parameter for close values.
-
Key High: Determines Shared Memory key name for high values. DataHigh is the default input parameter for high values.
-
Key Low: Determines Shared Memory key name for low values. DataLow is the default input parameter for low values.
-
Transfer Mode: Sets string- or array-based data transfer.
-
Data Delim.: Defines the value separator sign(s).
-
Number Format: Defines if Viz should get the decimal point separator from the System Locale or Custom settings. If Custom is enabled:
-
Decimal Symbol: Defines which symbol is used as decimal point when Custom Number Format is set.
-
-
Data Open, -Close, -High, -Low Fit: Enables data normalization.
-
Data Open, -Close, -High, -Low Scale: Scales input by the selected factor.
-
Data Open, -Close, -High, -Low Offset: Adds an offset to the incoming data.
-
Data Auto Scale: Enables automatic data normalization.
-
-
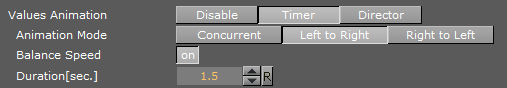
Value Animation: Sets the vertical animation type to be created when data change is detected:
-
Disable: No animation.
-
Timer: Creates data transition animation (from an old set of data to a new set) within the specified time set in Duration sec.. Also select an Animation Mode.
-
Director: Creates data transition animation with the Stage Director, that controls the Animation Progress parameter from 0.0% (old data) to 100.0% (new data). Also select an Animation Mode.
-
-
Animation Mode:
-
Concurrent: Changes all nodes concurrently.
-
Left to Right: Transitions from left to right.
-
Right to Left: Transitions from right to left.
-
-
Balance Speed: Set to On, when Animation Mode is set to Left to Right or Right to Left, and the position of transformed data is related to node values as well.
Example: Balance Speed: If the values of four nodes change from 0,0,0,0 to 1,9,90,900 in Left to Right mode at 50% of the transformation. Balance Speed Off: Only the first two nodes are transformed to new values. Balance Speed On: The first three nodes are already transformed to new values, and the last node also transformed to 44% of the new values, because the data change from 0 (0+0+0+0) to 1000 (1+9+90+900), at 50% of transformation (in this case the values is changed for 500 of 1000), the first three nodes are already finished and the last node is changed to 400.
-
Duration sec.: Sets the duration of the animation in seconds for Timer mode.
-
Data Nodes Animation: Sets the horizontal animation type to be created when number of data nodes change is detected.
![]()
-
Disable: No animation.
-
Timer: Creates data transition animation (from an old set of data to a new set) within the specified time set in Duration sec.
-
-
Duration sec.: Sets the duration of the animation in seconds for Timer mode.
When number of nodes is changes, stack chart looks for added and removed nodes from their values, adds new nodes to the chart from zero width and resizes all nodes to their new size in specified duration.
-
Data Detect Limits: Detects minimum and maximum of all values and scales them to adjusted Start and Stop.
-
Data Start: Determines lower auto scale edge.
-
Data Stop: Determines upper auto scale edge.
-
Draw Open: Draws open data.
-
Draw Close: Draws close data.
-
Draw High: Draws high data.
-
Draw Low: Draws low data.
-
Candle Corners: Sets candle segments.
-
Wick Corners: Sets wick corners.
-
Width Scaling
-
Single Candle: Adjusts size for a single candle.
-
Fit: Adjusts all candles to fit a certain width.
-
-
Candle Width: Value for the previous parameter.
-
Candle Gap Ratio%: 100% means that the gaps have the same size as the candles.
-
Candle Wick Ratio%: 100% means that the wicks have the same size as the candles.
-
Bevel Candle: Activates Bevel mode for the candle geometry.
-
Bevel Candle Top: Chamfers candle’s top.
-
Bevel Candle Bottom: Chamfers candle’s bottom.
-
Bevel Candle Size%: Adjusts bevel’s size from 0 to 100.
-
Bevel Candle Steps: Sets roundness via the number of segmentation steps.
-
-
Bevel Wick: Activates Bevel mode for the wick geometry.
-
Bevel Wick Top: Chamfers wick’s top.
-
Bevel Wick Bottom: Chamfers wick’s bottom.
-
Bevel Wick Size%: Adjusts bevel’s size from 0 to 100.
-
Bevel Wick Steps: Sets roundness via the number of segmentation steps.
-
-
Relative Length
-
On: Sets all accumulated candle lengths to equal 100%.
-
Off: Sets each candle to its own 100% (e.g. three candles: 300%).
-
-
Total Length: Value for the previous parameter.
-
Use Vertex Colors: Activates the following parameters.
-
Bull Candle Color: Defines the color for all candles where the close value is higher than the open value.
-
Bear Candle Color: Defines the color for all candles where the close value is lower than the open value.
-
High Wick Color: Sets high wick’s color.
-
Low Wick Color: Sets low wick’s color.
Note: A chamfer is a beveled edge connecting two surfaces.
-
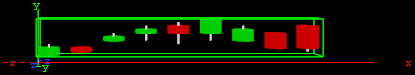
To Create a Stock Chart
-
Create a new group and add the Stock Chart plug-in to it.
-
Open the Transformation Editor and set Position X and Y to -100.0.
-
Open the Stock Chart editor and set the following parameters:
-
Set the Data Open parameter to the following values: 10,20,30,40,50,40,30,40,50.
-
Set the Data Close parameter to the following values: 20,15,35,45,40,60,45,20,20.
-
Set the Data High parameter to the following values: 25,20,40,50,55,60,50,40,50.
-
Set the Data Low parameter to the following values: 10,15,30,30,25,30,30,20,15.
-
Set Candle and Wick Corners to 10.
-
Set Candle Width to 25.0.
-
To Create a Stock Chart with Data Animation
Chart Animation using Data Storage
-
Follow the "To create a Stock Chart" instruction.
-
Modify the following parameters of Stock Chart plug-in.
-
Change Shared Mem. to Scene.
-
Set Values Animation to Timer.
-
Set Data Nodes Animation to Timer.
-
Set Width Scaling to Fit.
-
Set Candle Width to 325.
-
-
Add Data Storage plug-in into the same container.
-
Set Key Data1 to DataOpen.
-
Set Data1 to 10,20,30,40,40,30,40,50.
-
Set Key Data2 to DataClose.
-
Set Data2 to 20,15,35,45,60,45,20,20.
-
Set Key Data3 to DataHigh.
-
Set Data3 to 25,20,40,50,60,50,40,50.
-
Set Key Data4 to DataLow.
-
Set Data4 to 10,15,30,30,30,30,20,15.
-
-
Change Shared Mem. to Scene and animation chart shows from nine to eight nodes.
-
Update data with the same number of nodes.
-
Change Shared Mem. to Inactive.
-
Set Data1 to 40,30,50,25,20,40,55,45.
-
Set Data2 to 25,45,20,20,30,45,50,40.
-
Set Data3 to 55,50,50,40,40,55,55,50.
-
Set Data4 to 10,15,10,15,15,20,40,30.
-
-
Change Shared Mem. to Scene and values of nodes change in the animation.
-
Update data by adding two nodes.
-
Change Shared Mem. to Inactive.
-
Set Data1 to 40,30,20,50,25,20,40,30,55,45.
-
Set Data2 to 25,45,45,20,20,30,45,45,50,40.
-
Set Data3 to 55,50,50,50,40,40,55,55,55,50.
-
Set Data4 to 10,15,20,10,15,15,20,25,40,30.
-
-
Change Shared Mem. to Scene and animation chart shows from eight to ten nodes.
IMPORTANT! You must use the same platform (x64 / x86) of Microsoft Excel and Viz Engine.
Chart Animation Using Control Chart
-
Follow the "To create a Stock Chart" instruction.
-
Modify the following parameters of Stock Chart plug-in.
-
Set Values Animation to Timer.
-
Set Data Nodes Animation to Timer.
-
Set Width Scaling to Fit.
-
Set Candle Width to 325.
-
-
Add Control Chart plug-in into the same container and save the scene.
-
Open Viz Trio.
-
Import the scene.
-
Click "1 (StockChart)" in Tab Fields.
-
Edit values in Editing Template.
-
See Also