
Viz Artist User Guide
Version 3.12 | Published October 17, 2019 ©
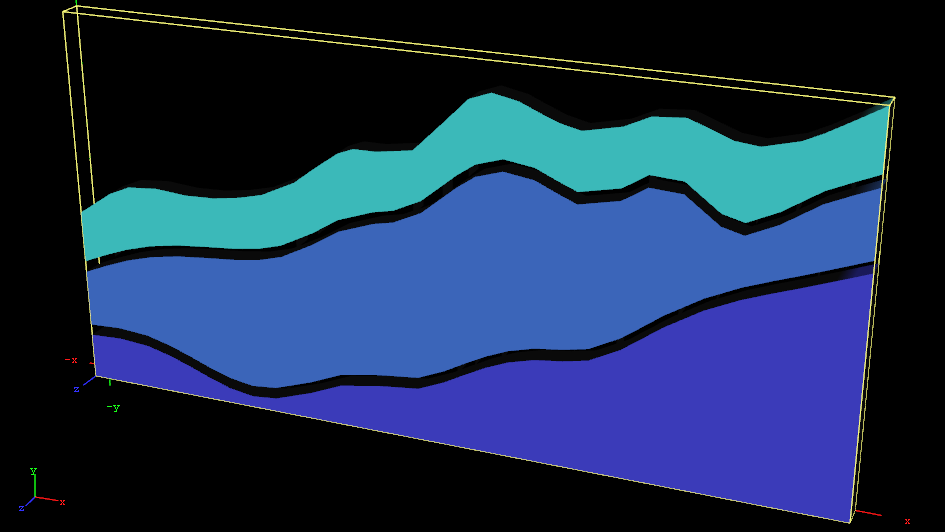
Area Stack
![]()
Create a stacked chart consisting of several Area Charts.
Note: This plug-in is located in: Built Ins -> Container plug-ins -> VisualDataTools
This page contains the following topics and procedures:
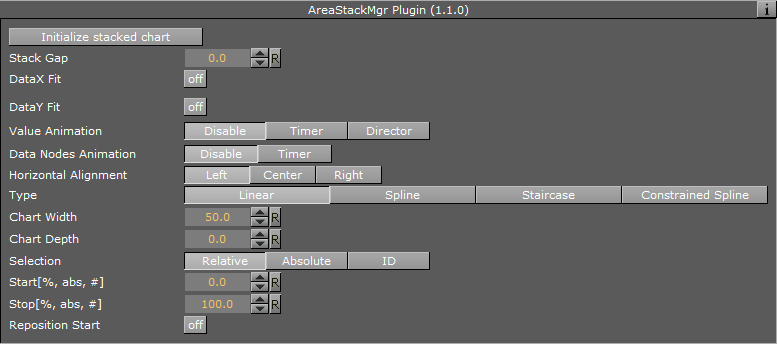
Area Stack Properties
-
Initialize stacked chart: Refreshes the stacked chart, based on the Area Chart plug-ins in the sub-containers. The stacked chart detects when a chart is added/removed from the stack, and updates the chart accordingly. However, some actions, such as re-ordering the charts within a stack, are not updated automatically. In these cases, press Initialize stacked chart to update the stack.
-
Stack Gap: Add space between each chart
Note: The remaining properties in the Line Stack plug-in are the same as used in the Area Chart plug-in. The Area Chart features Specify X Values, DataY Compare, and Bevel, are disabled in stacked charts.
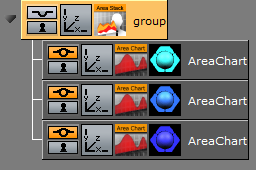
To Create a Scene with Area Stack
-
Create a new container.
-
Add an Area Stack plug-in into this container.
-
Add two or more Area Chart plug-ins to become children of this container.
-
Add Data Y into each chart. They should have the same number of nodes.
-
In the settings of the Area Stack plug-in, press Initialize Stacked Chart to refresh the chart.
-
Use the Area Stack plug-in to set the chart parameters that are common for all charts in the stack.