
Viz Artist User Guide
Version 3.12 | Published October 17, 2019 ©
Bar Chart
![]()
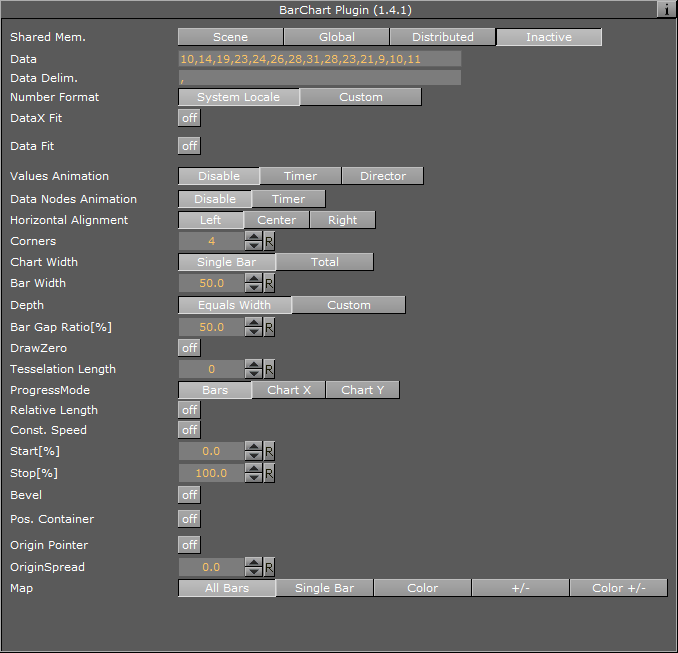
This plug-in draws a bar chart, filled with data out of a Shared Memory Map. You can use delimited strings or arrays for data transfer via Scene-, Global- or Distributed-Shared Memory.
Note: This plug-in is located in: Built Ins -> Geom plug-ins -> VisualDataTools
This page contains the following topics and procedures:
Bar Chart Properties
-
Shared Mem.: Changes between Scene, Global and Distributed Shared Memory. Use Inactive memory to not forward any values via Shared Memory and the data is taken from the Data field.
-
Data: Inputs chart data (available when Inactive is selected).
-
Key Data: Determines shared Memory key name (available when Scene, Global or Distributed is selected).
-
Transfer Mode: Sets String or Array based data transfer.
-
Data Delim.: Defines the value separator sign(s).
-
Number Format: Defines if Viz should get the decimal point separator from the System Locale or Custom settings. If Custom is enabled:
-
Decimal Symbol: Defines which symbol is used as decimal point when Custom Number Format is set.
Note: If the Bar Stack plug-in is used, the following Bar Chart properties need to be defined in the Bar Stack plug-in.
-
-
DataX Fit: Enables data normalization on the horizontal:
-
DataX Scale: Scales input by the selected factor.
-
DataX Offset: Adds an offset to the incoming data.
-
DataX Auto Scale: Enables automatic data normalization.
-
DataX Fit Size:
-
Total: Scales complete chart as per the defined Start and Stop settings.
-
Current: Scales the current chart segment to the set borders.
-
-
-
Data Fit: Enables data normalization:
-
Data Scale: Scales input by the selected factor.
-
Data Offset: Adds an offset to the incoming data.
-
Data Origin Offset: Adds an offset to the smallest/minimum value.
-
Data Auto Scale: Enables automatic data normalization.
-
Data Fit Size: Scales complete chart in dependency of the defined Start and Stop settings (Total) or scales the Current chart segment to the set borders.
-
Data Detect Limits: Detects minimum and maximum of all values and scales them to adjusted Start and Stop.
-
Data Threshold: Adds a definable offset to the detected limit.
-
Data Start: Lower Auto Scale edge.
-
Data Stop: Upper Auto Scale edge.
-
-
Compare: Specifies another BarChart for comparison. You have to set this parameter also in the other chart(s) so that each chart can react on changes of the other(s).
-
Value Animation:
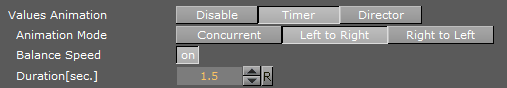
Sets the vertical animation type to be created when data change is detected:
-
Disable: No animation.
-
Timer: Creates data transition animation (from an old set of data to a new set) within the specified time set in Duration sec.. Also select an Animation Mode.
-
Director: Creates data transition animation with the Stage Director, that controls the Animation Progress parameter from 0.0% (old data) to 100.0% (new data). Also select an Animation Mode.
-
-
Animation Mode:
-
Concurrent: Changes all nodes concurrently.
-
Left to Right: Transitions from left to right.
-
Right to Left: Transitions from right to left.
-
-
Balance Speed: Relates node values to the position of transformed data when set to On and Animation Mode is set to Left to Right or Right to Left.
Example: Balance Speed: If the values of four nodes change from 0,0,0,0 to 1,9,90,900 in Left to Right mode at 50% of the transformation. Balance Speed Off: Only the first two nodes are transformed to new values. Balance Speed On: The first three nodes are already transformed to new values, and the last node also transformed to 44% of the new values, because the data change from 0 (0+0+0+0) to 1000 (1+9+90+900), at 50% of transformation (in this case the values is changed for 500 of 1000), the first three nodes are already finished and the last node is changed to 400.
-
Duration sec.: Sets the duration of the animation in seconds for Timer mode.
-
Data Nodes Animation: Sets the horizontal animation type to be created when number of data nodes change is detected.
![]()
-
Disable: No animation.
-
Timer: Creates data transition animation (from an old set of data to a new set) within the specified time set in Duration sec.
-
-
Duration sec.: Sets the duration of the animation in seconds for Timer mode.
When the number of nodes is changed, bar chart looks for added and removed nodes from their values, adds new nodes to the chart from zero width and resizes all nodes to their new size, specified in duration.
-
Horizontal alignment: Sets horizontal orientation to left, center or right.
-
Corners: Sets the bar’s corners.
-
Chart Width: Defines width for a single bar or for all bars.
-
Bar Width: Value of the previous parameter.
-
Max Width: Allows bars to grow only to a certain width.
-
Bar Gap Ratio: Adjusts the gap between the single bars. 0% means no gap.
-
Depth: Defines if the bar depth should equal its width or lets you set a custom depth.
-
Bar Depth: Adjusts bar depth in custom depth mode.
-
Draw Zero: If the Bar value is equivalent to 0, then a very flat bar is drawn instead of nothing.
-
Tessellation Length: Tessellates bar length.
-
Progress Mode:
-
Bars: Allows each bar grows to its value.
-
Chart X: The chart grows horizontally. Each bar comes in at its final height.
-
Chart Y: The chart grows vertically. All bars grow together to their final height.
-
-
Relative Length: If activated, each bar has its own 100% length (e.g. seven bars equal 700%).
-
Const. Speed: Sets the same animation duration for each bar.
-
Start%: Determines starting point of the graph.
-
Stop%: Determines stop point of the graph.
-
Bevel: Activates Bevel mode.
-
Bevel Top: Chamfers bar’s top.
-
Bevel Bottom: Chamfers bar’s bottom.
-
Bevel Size%: Adjusts bevel’s size from 0 to 100.
-
Bevel Steps: Sets roundness via the number of segmentation steps.
Note: A chamfer is a beveled edge connecting two surfaces.
-
-
Pos. Container: Translates every child container to a bar’s top.
-
Container Offset: Adds a certain offset to each container.
-
Container Offset X: Adds a X Axis offset to each container.
-
Container Offset Y: Adds a Y Axis offset to each container.
-
Container Offset Z: Adds a Z Axis offset to each container.
-
Center Container: Centers each translated container.
-
Size Compensation: Repositions containers if they can change their size. E.g. Text geometries used as chart labels. The labels vary in their width which requires a repositioning if a horizontal BarChart (rotated 90 deg) is used.
-
None: Deactivates container size compensation.
-
Width: Compensates width changes.
-
Height: Compensates height changes.
-
-
Map: Calculates texture coordinates for all bars, a single bar or defines vertex colors instead. Colors can be set individually for each bar or value dependent (+/- color). In the Color +/- mode you can override value dependent colors.
-
Color ID: Moves between the available vertex colors.
-
Color: Chooses color for the current ID.
-
Positive: Chooses color for positive values.
-
Negative: Chooses color for negative values.
-
Color Override: Activates or deactivates overriding of a positive or negative color with a defined alternative color.
-
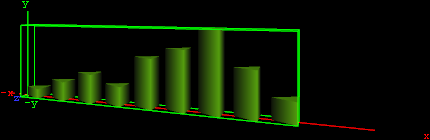
To Create a Bar Chart
-
Create a new group and add the Bar Chart plug-in to it.
-
Open the Transformation Editor and set Position X and Y to -100.0 and Rotation Y to -25.0.
-
Add a material and/or a texture to it.
-
Open the Bar Chart editor and set the following parameters:
-
Set the following DataY values: 10,20,30,20,50,60,80,45,20.
-
Set Corners to 3.
-
Set Bar Width to 20.0.
-
Set Bar Gap Ratio[%] to 10.0.
-
To Create a Bar Chart with Data Animation
Chart Animation Using Data Import
The following steps are to prepare data sets for animation in Excel file.
-
Start Microsoft Excel.
-
Enter ExcelData1 into cell A1.
-
Add some sample values in the cells below (A2-A8: 80, 35, 45, 75, 85, 55, 60).
-
Enter ExcelData2 into cell A2.
-
Add some sample values in the cells below (B2-B9: 80, 35, 45, 75, 40, 85, 55, 60).
-
Enter ExcelData3 into cell A3.
-
Add some sample values in the cells below (C2-C9: 40, 60, 75, 85, 80, 55, 45, 35).
-
Enter ExcelData4 into cell A4.
-
Add some sample values in the cells below (D2-D8: 60, 75, 85, 80, 55, 45, 35).
-
Rename this first sheet to MyTable (can be done with a double click on the sheet name at the bottom).
-
Follow one of the following methods to make Viz Engine can read this Excel data file
-
Save and close the Excel document.
-
Share the Excel document.
-
On the Review tab, in the Changes group, click the Share Workbook button.
-
The Share Workbook dialog box appears, and you select the Allow changes by more than one user at the same time. check box on the Editing tab.
-
Click Ok button of the dialog
-
Save the Excel document.
-
-
IMPORTANT! You must use the same platform (x64 / x86) of Microsoft Excel and Viz Engine.
After the data sets are created, the following steps are to create a Data Animation scene.
-
Follow the "To create a Bar Chart" instruction.
-
Modify the following parameters of Bar Chart plug-in.
-
Change Shared Mem. to Scene.
-
Set Kay Data to Data.
-
Set Data Delim. to #.
-
Set Values Animation to Timer.
-
Set Data Nodes Animation to Timer.
-
-
Add Data Import plug-in into the same container.
-
Set File to above prepared Excel file.
-
Set Table / Sheet to MyTable.
-
Set Column(,Col...) to ExcelData1.
-
Set Data Delim. to #.
-
Set Shared Mem. to Scene.
-
Set Key to Data.
-
-
Click the GetIt button and animation chart shows from zero to seven nodes.
-
Add one data node in the middle of chart (Horizontal Animation).
-
Set Column(,Col...) to ExcelData2.
-
Click the GetIt button.
-
-
Change values of eight data nodes (Vertical Animation).
-
Set Column(,Col...) to ExcelData3.
-
Click the GetIt button.
-
-
Remove the first data node (Horizontal Animation).
-
Set Column(,Col...) to ExcelData4.
-
Click the GetIt button.
-
Note: You can add more data columns and play with animation on difference data change.
Chart Animation Using Control Chart
-
Follow the "To create a Bar Chart" instruction.
-
Modify the following parameters of Bar Chart plug-in.
-
Set Values Animation to Timer.
-
Set Data Nodes Animation to Timer.
-
-
Add Control Chart plug-in into the same container and save the scene.
-
Open Viz Trio.
-
Import the scene.
-
Click "1 (BarChart)" in Tab Fields.
-
Edit values in Editing Template.
-
See Also