
Viz Artist User Guide
Version 3.12 | Published October 17, 2019 ©
Pie Chart
![]()
This plug-in draws a pie chart, filled with data out of a Shared Memory Map. You can use delimited strings or arrays for data transfer via Scene-, Global- or Distributed-Shared Memory.
Note: This plug-in is located in: Built Ins -> Geom plug-ins -> VisualDataTools
This page contains the following topics and procedures:
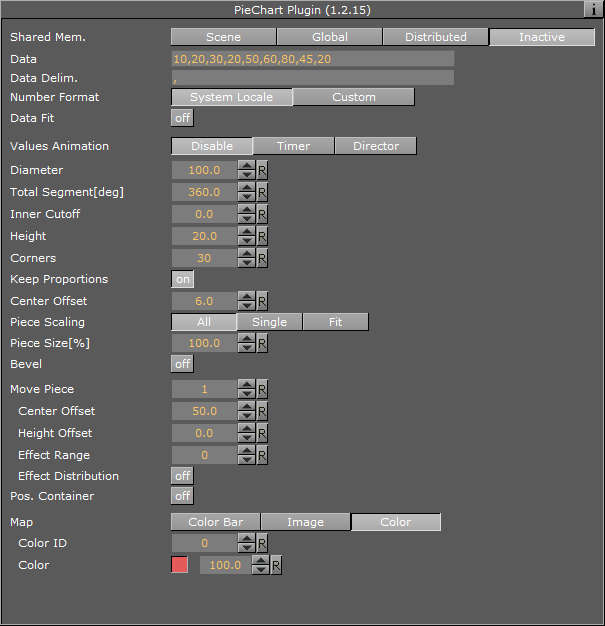
Pie Chart Properties
-
Shared Mem.: Changes between Scene, Global and Distributed Shared Memory. Use Inactive memory to not forward any values via Shared Memory and the data is taken from the Data field.
-
Data: Determines Shared Memory key name. Data is the default input parameter.
-
Transfer Mode: Sets string- or array-based data transfer.
-
Data Delim.: Defines the value separator sign(s).
-
Number Format: Defines if Viz should get the decimal point separator from the System Locale or Custom settings. If Custom is enabled:
-
Decimal Symbol: Defines which symbol is used as decimal point when Custom Number Format is set.
-
-
Data Fit: Enables data normalization.
-
Data Offset: Adds an offset to the incoming data.
-
-
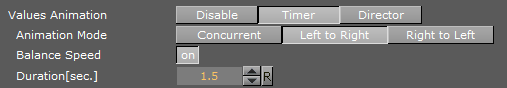
Values Animation:
Sets the animation type to be created when data change is detected.
-
Disable: No animation.
-
Timer: Creates data transition animation (from an old set of data to a new set) within the specified time set in Duration sec.. Also select an Animation Mode.
-
Director: Creates data transition animation with the Stage Director, that controls the Animation Progress parameter from 0.0% (old data) to 100.0% (new data). Also select an Animation Mode.
-
-
Animation Mode:
-
Concurrent: Changes all nodes concurrently.
-
Left to Right: Transitions from left to right.
-
Right to Left: Transitions from right to left.
-
-
Balance Speed: Relates node values to the position of transformed data when set to On and Animation Mode is set to Left to Right or Right to Left.
Example: Balance Speed: If the values of four nodes change from 0,0,0,0 to 1,9,90,900 in Left to Right mode at 50% of the transformation. Balance Speed Off: Only the first two nodes are transformed to new values. Balance Speed On: The first three nodes are already transformed to new values, and the last node also transformed to 44% of the new values, because the data change from 0 (0+0+0+0) to 1000 (1+9+90+900), at 50% of transformation (in this case the values is changed for 500 of 1000), the first three nodes are already finished and the last node is changed to 400.
-
Duration sec.: Sets the duration of the animation in seconds for Timer mode.
-
Diameter: Sets size of pie chart.
-
Total Segmentdeg: Sets the pie chart’s maximum angle in degrees (default: 100% are equal to 360 degrees).
-
Inner Cutoff: Cuts off a round piece from the cake’s center.
-
Height: Adjusts height.
-
Corners: Defines the minimum amount of corners at the pie’s edge. In dependency on the number of pieces an algorithm adds corners to always give the pie chart the same appearance.
-
Keep Proportions: If enabled, the pie chart would look real. Otherwise each piece’s radius is recalculated.
-
Const. Offset: Sets a constant gap width.
-
Center Offset: Determines each pieces’ distance from the pie’s center.
-
Piece Scaling:
-
All: All pieces equal 100%.
-
Single: Every piece’s size is described by its own 100%(e.g. three pieces mean 300%).
-
Fit: All pieces equal 100%, but they are scaled relatively to fit their new area with the correct values.
-
-
Piece Size%: Parameter for the previous option.
-
Bevel: Activates Bevel mode.
-
Bevel Top: Chamfers cake’s top.
-
Bevel Bottom: Chamfers pie’s bottom.
-
Bevel Size%: Adjusts bevel’s size from 0 to 100.
-
Bevel Steps: Sets roundness via the number of segmentation steps.
-
-
Move Piece: Defines the piece for the next parameter operation. Starts with 0, -1 means nothing selected.
-
Center Offset: Offsets center for a certain piece.
-
Height Offset: Offsets height for a certain piece.
-
Effect Range: Sets the range of pieces to move.
-
Effect Distribution: Sets the distribution of the effect range.
-
-
Pos. Container: Translates every child container to a piece of cake.
-
Container Offset: Adds a certain center offset to each container.
-
Center Container: Centers each translated container.
-
PosX, Y, Z: Activates container translation on the particular axis.
-
Container Pos. Z%: Sets the relative position on the z axis for each child container.
-
-
Map:
-
Color Bar: Sets a single color (V texture coordinate) for a certain piece(e.g. three pieces: V = 0.0, V = 0.5 and V = 1.0).
-
Vertex: Uses vertex colors for each piece starting with ID 0. Color ID moves between the available vertex colors. Color lets you choose color for the current ID.
Note: A chamfer is a beveled edge connecting two surfaces.
-
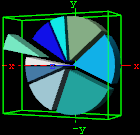
To Create a Pie Chart
-
Create a new group and add the Pie Chart plug-in to it.
-
Open the Transformation Editor and set Position X and Y to -100.0 and Rotation Y to -25.0.
-
Add a material and/or a texture to it.
-
Open the Pie Chart editor and set the following parameters:
-
Set the following DataY values: 10,20,30,20,50,60,80,45,20.
-
Enable Keep Proportions.
-
Set Center Offset to 6.0.
-
Set Move Piece to 1.
-
Set Center and Height Offset to 20.0.
-
Enable Vertex and set different colors for all Color IDs.
-
To Create a Pie Chart with Data Animation
Chart Animation Using Data Import
Prepare data sets for animation in Excel file.
-
Start Microsoft Excel.
-
Enter ExcelData1 into cell A1.
-
Add some sample values in the cells below (A2-A8: 80, 35, 45, 75, 85, 55, 60).
-
Enter ExcelData2 into cell A2.
-
Add some sample values in the cells below (B2-B9: 80, 35, 45, 75, 40, 85, 55, 60).
-
Enter ExcelData3 into cell A3.
-
Add some sample values in the cells below (C2-C9: 40, 60, 75, 85, 80, 55, 45, 35).
-
Enter ExcelData4 into cell A4.
-
Add some sample values in the cells below (D2-D8: 60, 75, 85, 80, 55, 45, 35).
-
Rename this first sheet to MyTable (can be done with a double click on the sheet name at the bottom).
-
Follow one of the following methods to make Viz Engine can read this Excel data file
-
Save and close the Excel document.
-
Share the Excel document.
-
On the Review tab, in the Changes group, click the Share Workbook button.
-
The Share Workbook dialog box appears, and you select the Allow changes by more than one user at the same time. check box on the Editing tab.
-
Click Ok button of the dialog
-
Save the Excel document.
-
-
IMPORTANT! You must use the same platform (x64 / x86) of Microsoft Excel and Viz Engine.
Create a Data Animation scene
-
Follow the "To create a Pie Chart" instruction.
-
Modify the following parameters of Pie Chart plug-in.
-
Change Shared Mem. to Scene.
-
Set Data Delim. to #.
-
Set Values Animation to Timer.
-
-
Add Data Import plug-in into the same container.
-
Set File to above prepared Excel file.
-
Set Table / Sheet to MyTable.
-
Set Column(,Col...) to ExcelData1.
-
Set Data Delim. to #.
-
Set Shared Mem. to Scene.
-
Set Key to Data.
-
-
Click the GetIt button and chart shows from zero to seven nodes.
-
Change to the another data set.
-
Set Column(,Col...) to ExcelData2 or ExcelData3 or ExcelData4.
-
Click the GetIt button.
-
-
Repeat step 5 with another data set including ExcelData1.
Note: You can add more data columns and play with animation on difference data change.
Chart Animation Using Control Chart
-
Follow the "To create a Pie Chart" instruction.
-
Modify the following parameters of Pie Chart plug-in.
-
Change Values Animation property to Timer.
-
Add Control Chart plug-in into the same container and save the scene.
-
Open Viz Trio.
-
Import the scene.
-
Click "1 (PieChart)" in Tab Fields.
-
Edit values in Editing Template.
-
See Also