
Viz World Classic User Guide
Version 23.0 | Published December 12, 2023 ©
Setting up ESRI Shape File Data
Data in ESRI Shape File format may contain a large number of different attributes and values which describe the data contained in the file. In order for Viz World Classic to understand how to draw the data, you first need to create a data set definition that describes which features are to be drawn and in which style.
This section contains information on the following procedures:
To Create a Data Set Definition
-
On the Import menu, click Map Data (Shape Files)... to display the Imported Data Sets dialog box.
-
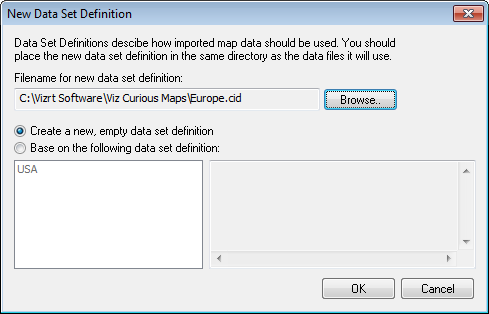
Click the Create a Data Set Definition button:

The following dialog box allows you to select an existing data set definition as the basis for the new one:
-
Click the Browse... button to specify the filename for the new data set definition.
If you want to base the data set definition on an existing one:
-
Click Base on the following data set definition and select a definition in the list.
-
Click the OK button to create the new data set definition. It is displayed in the Imported Data Sets dialog box.
To Edit the Data Set
-
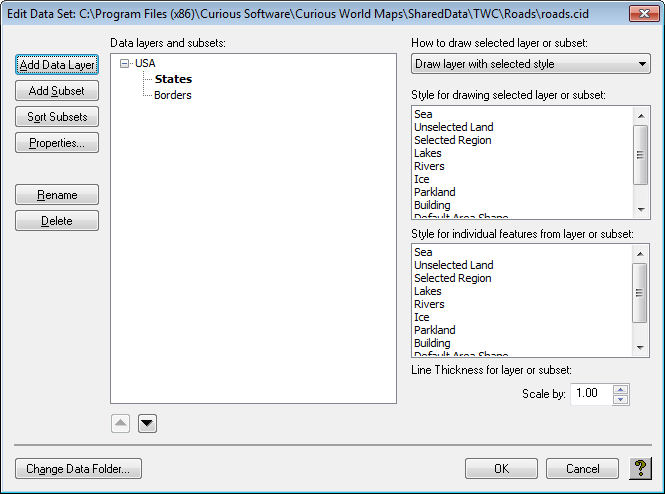
Select the data set definition in the Data Sets list.
-
Click the Edit Data Set Definition button. The Edit Data Set dialog box allows you to edit the data set definition.
-
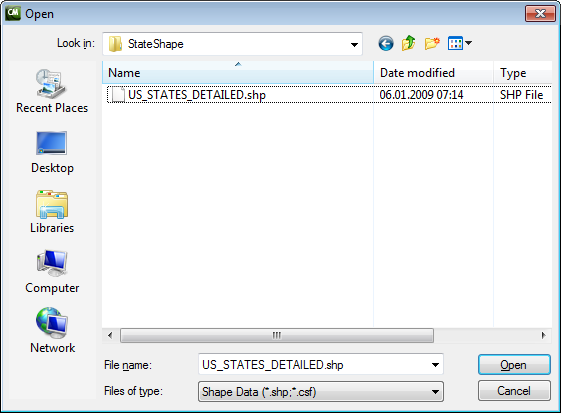
Click the Add Data Layer button.
-
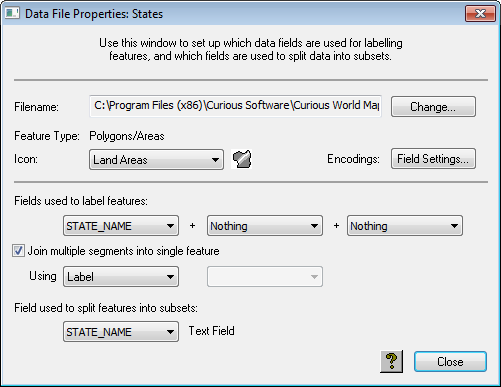
Select the data file you want to add. Supported file formats are .shp (Shape File) and .csf (Curious Shape File). The Data File Properties dialog box then allows you to specify how the features in the data file you have loaded are labeled on the map.
-
Choose up to three fields from the Fields used to label features drop-down menus. Each street is labeled with the specified field values.
-
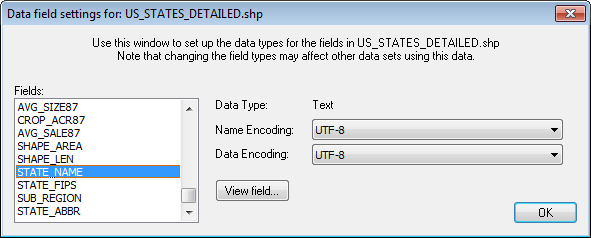
Click the Field Settings... button to display the following dialog box, which allows you to specify the encodings for each field in the file:
-
Select one or more fields in the Fields list, then choose the relevant encodings from the Name Encoding and Data Encoding pop-up menus. You can preview the effect of the encodings by clicking the View field… button.
-
Click the Close button to save the data layer in the data set definition.
To Add Subsets to a Data Layer
You can create subsets of a database file based on the contents of a specified field. This allows you to filter the database, and display each subset in a different style.
-
Open the Data File Properties dialog box and choose the field you want to use to divide the database into subsets from the Field used to split features into subsets drop-down menu. For example, to divide states according to east and west coast states.
-
Click the Close button to close the Data File Properties dialog box.
-
Select the appropriate data layer in the Edit Data Set dialog box.
-
Click the Add Subset button.
-
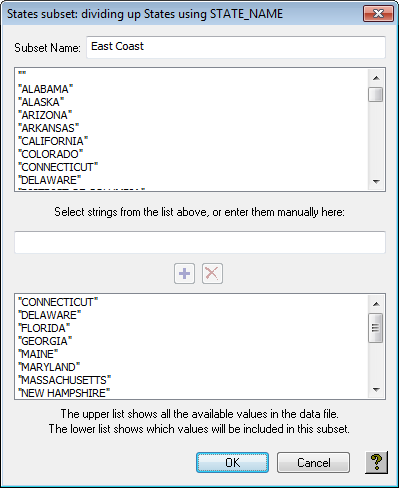
The following dialog box displays a list of the available values for the specified field in the data file and allows you to select values to create the subset.
-
-
Select the values you want to use in the upper list and click the + button to add them to the lower list.
-
Hold down SHIFT to select multiple contiguous items, and CTRL to select multiple non-contiguous items. For example, to create a subset containing only the East Coast states you could select and add those.
-
Enter a name for the subset in the Subset Name field.
-
Click the OK button to save the subset definition.
To Define the Style for Data Layers or Subsets
You can define a separate style for each data layer or subset you have created, to distinguish them on the final map.
-
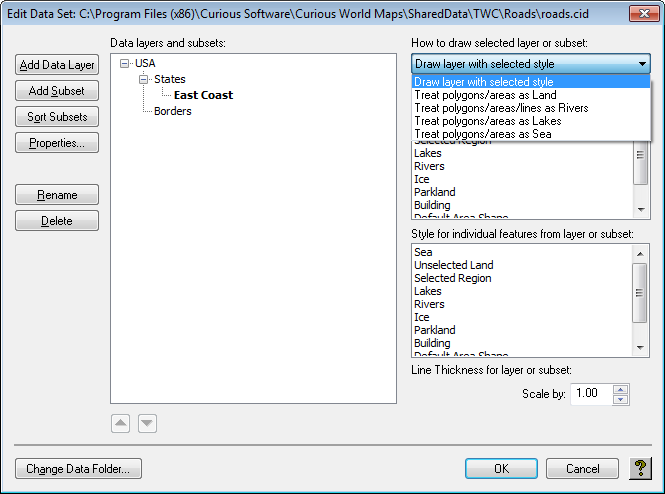
Select the data layer or subset in the Edit Data Set dialog box.
-
Select Draw layer with selected style from the How to draw selected layer or subset drop-down menu.
-
Select the styles for drawing the selected layer or subset, and the style for drawing individual features, in the lists on the right side of the Edit Data Set dialog box:
-
Appropriate styles are listed in the Style lists depending on whether the type of the layer is Area, Line, or Point.
-
Alternatively, select Draw polygons/areas as Land, Draw polygons/area/lines as Rivers, Draw polygons/areas as Lakes or Draw polygons/areas as Sea from the How to draw selected layer or subset drop-down menu to treat the selected layer in the same way as the built-in land, rivers, lakes or sea respectively.
-
The Scale by box allows you to scale the line thickness defined by the style. For example, you can identify different types of roads by using the same Primary Roads style but different Scale by settings for the line thickness.
-
-
Enter a value to scale the line thickness and press the RETURN key.
-
Repeat for any other data layer or subsets.
See Also
-
How to edit any of the styles using the Styles Editor in the Working with Styles section