
Viz Artist User Guide
Version 5.0 | Published December 20, 2022 ©
Performance Bar
This section also contains information on the following topics and procedures:
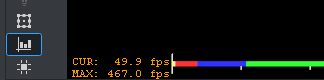
The performance bars are different between the Viz Engine Render Pipeline and the Classic Render Pipeline. To show the Performance Bar, click ![]() in the Scene Editor.
in the Scene Editor.
Do not use the maxfps as an indicator of your performance. The important factor is the current fps, this value needs to be stable on your output refresh rate (50 fps or 60fps). Rendering on 50Hz means that the whole operation of downloading live sources from Media Assets, rendering, composing and uploading to the video IO board must not take more than 25ms. The Performance Bar lists all those operations and gives you an indication on where to optimize your scene to run in real time.
When rendering on Viz Engine Pipeline, the Rendergraph also allows an even more in depth analysis of your post processing effects.
Viz Engine Render Pipeline
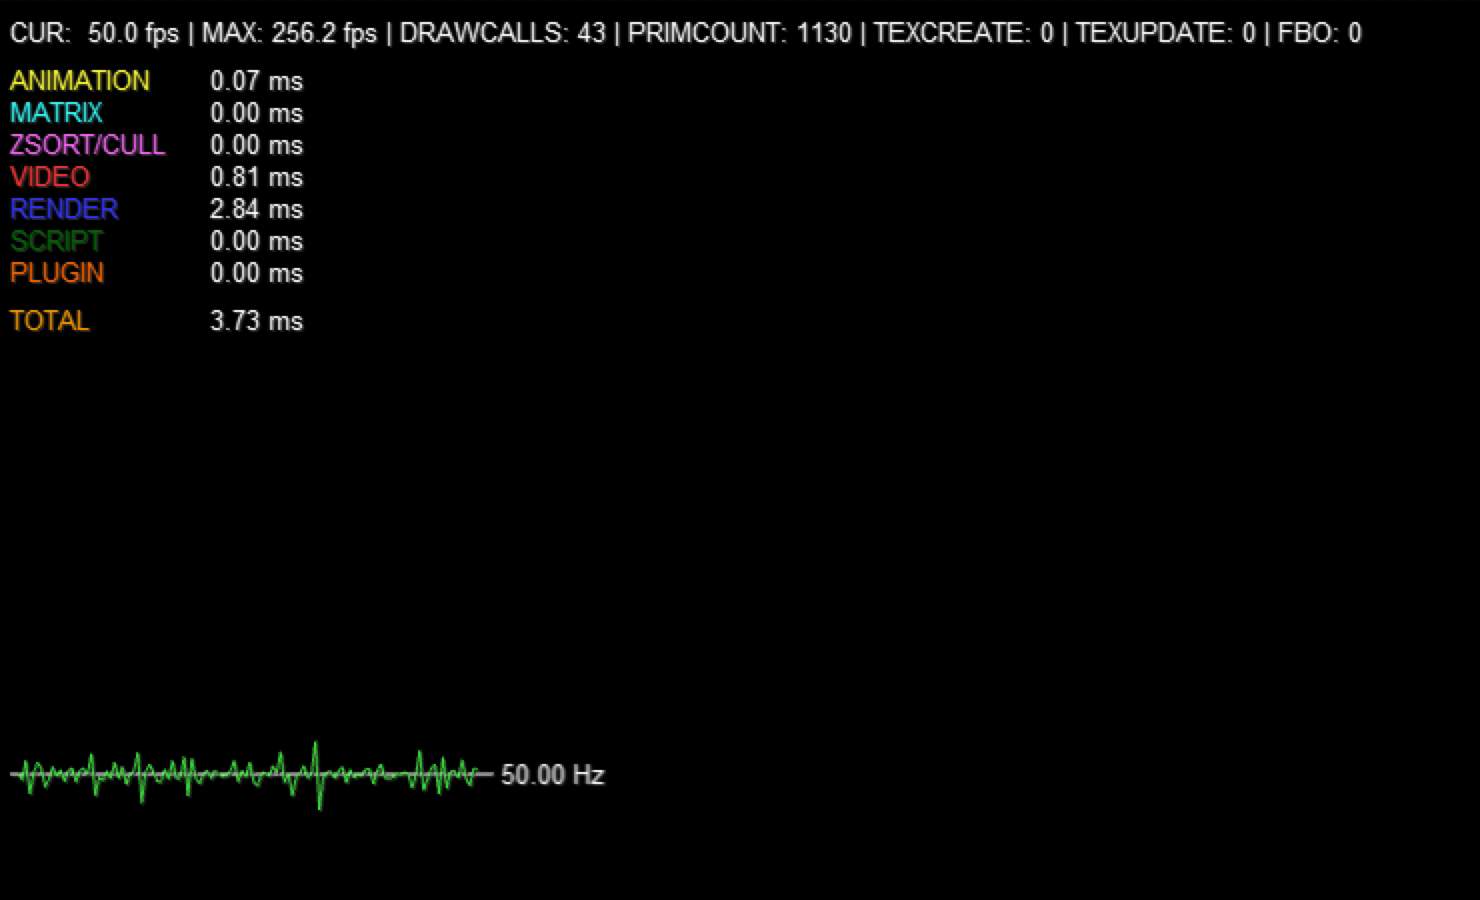
In the Viz Engine Render Pipeline, the Performance Bar shows a timeline for the current frames per second. This allows a user to identify performance issues (for example, when playing an animation). When rendering in real time, the line is green, anything else turns the line to red. The information shown on top is identical to the values in the Classic Render Pipeline.
Classic Render Pipeline
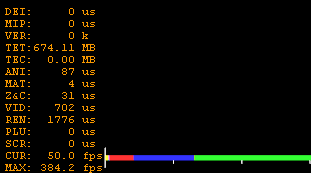
A Performance Bar can be shown at the bottom of the Scene Editor. The Performance Bar gives an indication of the performance (frames per second) the Scene is rendering in.
Note: A Performance Bar can also be shown in On Air Mode (see Viz Engine Performance).
Performance Bar Properties
-
VER (Vertices): Shows the number of vectors in the scene.
-
TET (AllocTexSize): Shows the total allocated size of Texture memory.
-
TEC (TexSize): Shows the size of the current in use Texture memory.
Note: The actual drawing of Textures has an impact on the performance, more visible textures cause more render time. If texture memory is low it is possible that Textures are not visible in the Scene. The Texture memory usage is an indication for this.
-
ANI (Animation): Shows how many microseconds all active directors and animation channels take. This indicator is linked to the yellow bar.
-
MAT (Matrix): Transforms each container in the scene into world coordinate space. This indicator is linked to the cyan bar.
-
Z&C (Z-Sort): Refers to Z-sort and Culling, and sorts all containers for correct transparency drawing and determines if containers are visible in the current camera view. This indicator is linked to the pink bar.
-
VID (Video): Shows how many microseconds video input (live video Media Asset) and video output take. De-interlaced video inputs take longer time than progressive and interlaced. The only way to improve this value is to use a faster system. This indicator is linked to the red bar.
-
REN (Rendering): Shows how many microseconds it takes to render all objects on the screen. A faster graphics card improves this value. This indicator is linked to the blue bar.
-
PLU (plug-in): Indicates how much time in microseconds all active plug-ins spend in each render cycle. This indicator is linked to the orange bar.
-
SCR (Script): Shows the consumed time in microseconds from all active scripts. This indicator is linked to the dark green bar.
-
CUR (Current): Shows how many frames per second the scene render at in On Air mode. The number should be above 50 (PAL) or 60 (NTSC), according to the rate that has been specified in the Output Format section.
-
MAX (Maximum): Shows how many frames per second the scene can render at without waiting for vertical retrace. The higher the maximum value, the more performance is left. If the maximum value is reduced to below 50 or 60, the scene is not rendering in real-time.
-
Blue bar: Shows the number of frames used.
-
Green bar: Shows the number of frames available. The Performance Bar refresh rate can be modified in User Interface (see the Configuring Viz section of the Viz Engine Administrator Guide).
To View All Performance Bar Indicators
-
Middle-click
 .
.
See Also