
Viz Artist User Guide
Version 5.0 | Published December 20, 2022 ©
Viz Engine Performance
The performance of Viz Engine can be analyzed with either:
-
The Performance Editor: This closely monitors a range of parameters to analyze the real-time performance of Viz Artist/Engine
-
The Performance Analyzer: This monitors key performance and camera parameters as a head-up display in the renderer window. It also initiates the log of statistic, command and event information to the log file(s).
This section contains information on the following topics:
Performance Analyzer
The performance analyzer enables key performance and camera information to be shown in the renderer view as a head-up display. Additionally the performance analyzer can be used to write statistics, command and event information to the log files.
Note: Log files are located at <viz data folder>.
This section contains information on the following topics and procedures:
To Open the Performance Analyzer
Hold CTRL while clicking the right mouse button on the show commands ( ![]() ) button in Viz.
) button in Viz.
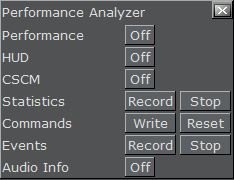
Performance Analyzer Properties
-
Performance: Shows or hides the Performance Bar (Current (CUR) and Maximum (MAX) parameters) in the Scene Editor and Render Preview
 .
. -
HUD: Enables the Head-up Display (HUD). The HUD shows the following parameters in the renderer view:
-
Camera 1-n: Shows the currently selected camera.
-
Position: Shows the camera’s X, Y and Z position.
-
Pan/Tilt/Twist: Shows the camera’s pan, tilt and twist parameters.
-
FovX/FovY: Shows the camera’s field of view (fov) for the horizontal (X) and vertical (Y) plane.
-
Center Shift: Shows the X and Y position of the camera’s center shift.
-
-
CSCM: Shows the center shift as a cross hair in the renderer.
-
Statistics: Writes statistics to the log file.
-
Commands: Writes a command to the log file.
-
Events: Writes events to the log file.
Note: These write to log file buttons are useful if there are ongoing problems with Viz Artist. Record and send the log file to Vizrt.
Performance Editor
The Performance Editor gives an idea of the current scene rendering performance (frames per second).
Open the Performance Editor
-
Click
 .
. -
Click Expand
 to show or hide the performance parameters.
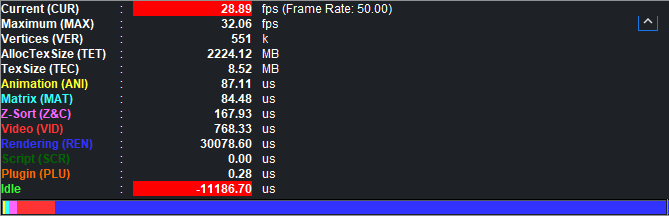
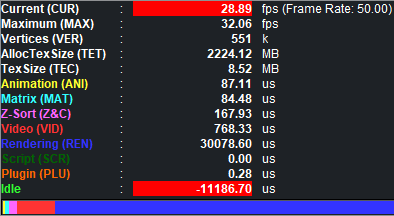
Performance Editor Properties
-
Current (CUR): Shows how many frames per second the scene renders at in On Air mode. The number should be above 50 (PAL) or 60 (NTSC), according to the rate that has been specified in Output Format (see the Configuring Viz section of the Viz Engine Administrator Guide).
-
Maximum (MAX): Shows how many frames per second the scene can render at without waiting for vertical retrace. The higher the maximum value, the more performance is left. If the maximum value is reduced to below 50 or 60, the scene is not rendering in real-time.
-
Vertices (VER): Shows the number of vectors in the scene.
-
AllocTexSize (TET): Shows the total allocated size of texture memory.
-
TexSize (TEC): Shows the size of the currently used texture memory.
-
Animation (ANI): Shows how many microseconds all active directors and animation channels take. This indicator is linked to the yellow bar.
-
Matrix (MAT): Transforms each container in the scene into world coordinate space. This indicator is linked to the cyan bar.
-
Z-Sort (Z&C): Refers to Z-sort and Culling, and sorts all containers for correct transparency drawing and determines if containers are visible in the current camera view. This indicator is linked to the pink bar.
-
Video (VID): Shows how many microseconds video input (live video texture) and video output take. De-interlaced video inputs take longer time than progressive and interlaced. The only way to improve this value is to use a faster system. This indicator is linked to the red bar.
-
Rendering (REN): Shows how many microseconds it takes to render all objects on the screen. A faster graphics card improves this value. This indicator is linked to the blue bar.
-
Script (SCR): Shows consumed time in microseconds from all active scripts. This indicator is linked to the dark green bar.
-
plug-in (PLU): Shows time, in microseconds, all active plug-ins spend in each render cycle. This indicator is linked to the orange bar.
-
Idle: Shows available resources, in microseconds, the renderer has available. This indicator is linked to the light green bar.