
Viz Artist User Guide
Version 5.0 | Published December 20, 2022 ©
Profiling
If you are running into performance issues, it is required to strip down your scene and to optimize it. The new Scene tree implementation offers a profiling tool exactly for these tasks. You can find the profiler on the toolbar of the scene tree:
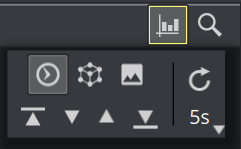
This opens the profiler tools, similar to the search tools. There are three different options available:
The profiler acts like a heatmap on your scene. More red means heavier impact. The results are shown next to the affected containers. In addition, the hits are marked inside the scrollbar and the navigation buttons can be used to jump from the topmost affected container downwards.
Tip: Make sure your containers are all expanded to make sure the scrollbar is able to show the entries.
Use the navigation buttons to jump from the top most to the lowest affected director:
|
Icon |
Description |
|
|
Shows the most affected container. |
|
|
Jumps to next less affected container. |
|
|
Jumps to previous more affected container. |
|
|
Jumps to the less affected container. |
To Optimize Render Time
![]() The first option is most probably the most important one. It analyzes the scene and returns those containers that require the most time to render.
The first option is most probably the most important one. It analyzes the scene and returns those containers that require the most time to render.
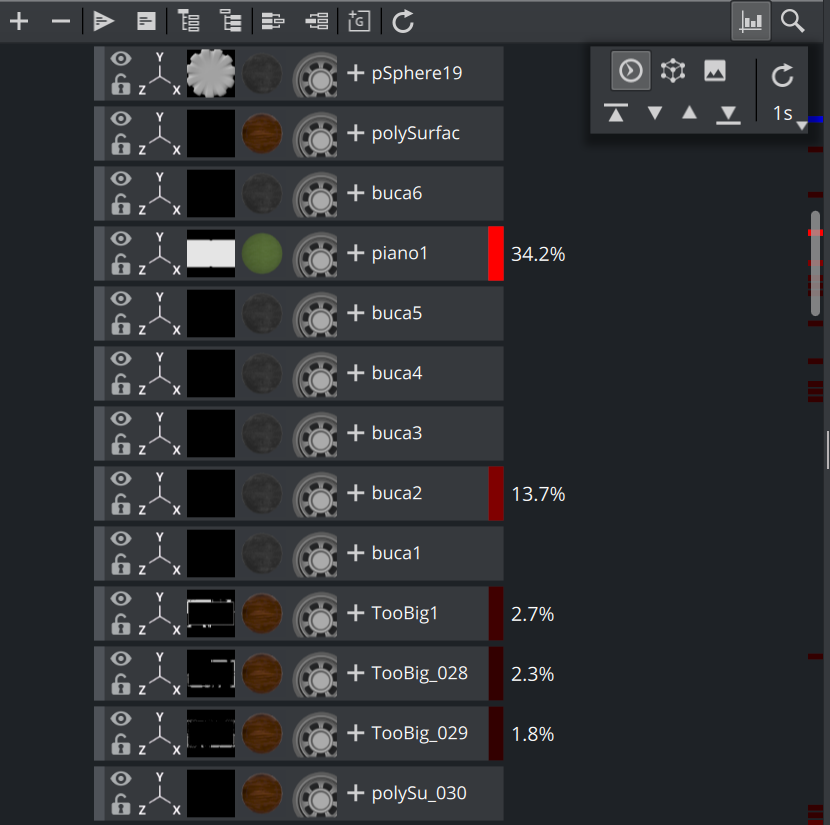
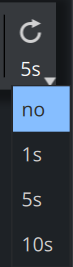
Please note that this is a snapshot of the current state at a given time. When showing a different view or during an animation these values can be completely different. Therefore, a time function has been added to choose the interval your measurements shall be taken. This can be manually (refresh icon) or on a given interval of one, five or ten seconds.
To Optimize Your Geometries
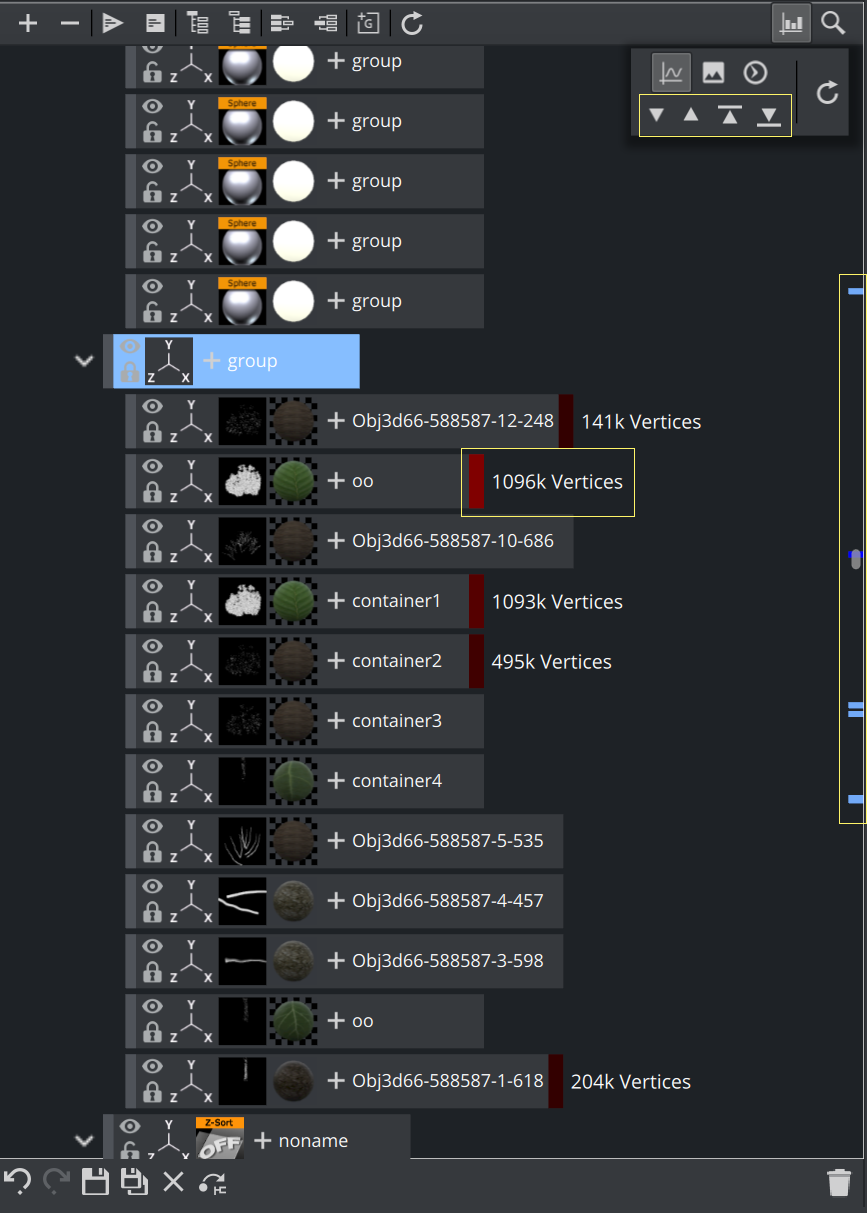
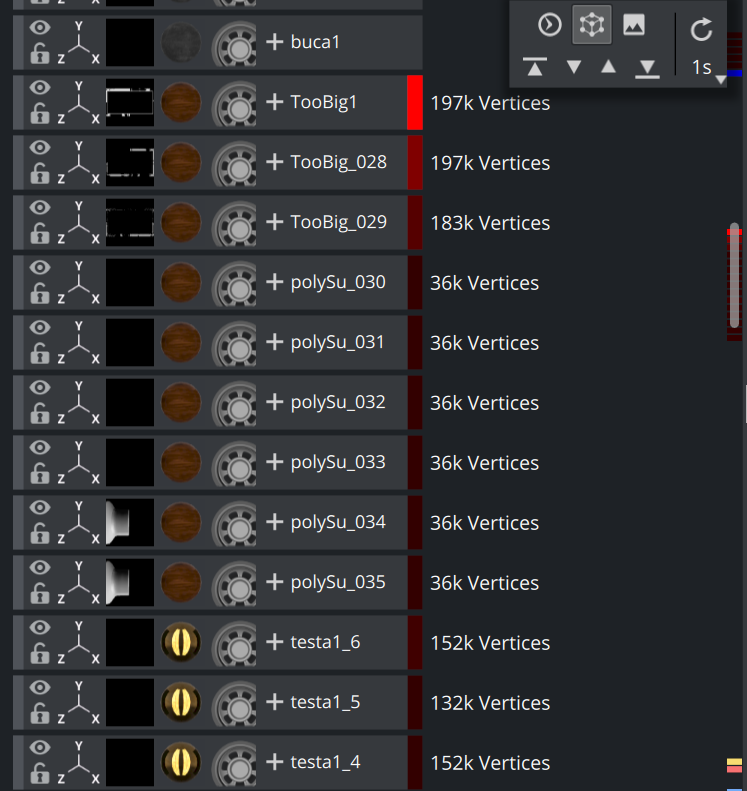
![]() Even though modern graphics boards can process millions of triangles, it might be necessary to reduce the complexity of your models. To identify which geometry has a high vertices count, use this tool. Only containers with geometries applied are included. The number of vertices is shown next to the container:
Even though modern graphics boards can process millions of triangles, it might be necessary to reduce the complexity of your models. To identify which geometry has a high vertices count, use this tool. Only containers with geometries applied are included. The number of vertices is shown next to the container:
To Reduce Texture Size
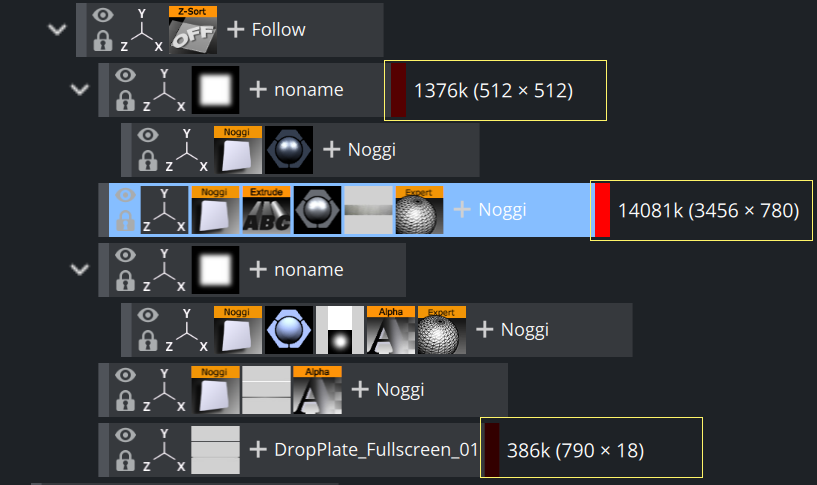
![]() The available texture memory on GPUs is limited, even if they have Gigabytes of memory. Heavier textures also increase the loading time of your scene as they need to be transferred onto the graphics board. And keep in mind that they also need to be loaded into regular memory. Huge textures can have an performance impact if the driver of the GPU needs to start optimizing or freeing up available memory. To optimize your scene, search for the largest textures and check if they can be replaced with a smaller one.
The available texture memory on GPUs is limited, even if they have Gigabytes of memory. Heavier textures also increase the loading time of your scene as they need to be transferred onto the graphics board. And keep in mind that they also need to be loaded into regular memory. Huge textures can have an performance impact if the driver of the GPU needs to start optimizing or freeing up available memory. To optimize your scene, search for the largest textures and check if they can be replaced with a smaller one.
Information: This feature currently works only for scenes in the Classic Render Pipeline. Profiling Material Definitions will be included in one of the next versions of Viz Engine.
See Also