
Viz Artist
Version 3.10 | Published May 03, 2018 ©
Advanced Bar Chart Creation
This section outlines some of the more advanced features of the Bar Chart geometry plug-in. The example provided is aimed at designers familiar with the Viz Artist user interface and prior knowledge of advanced scene design techniques, such as the use of control plug-ins and scripting.
This brief tutorial consists of the following sections:
Additionally, feel free to download a more extensive Tutorial from www.vizrt.com under Training, which also covers the other VDT plug-ins.
Establishing the Basic Bar Chart
In this first section, the basic bar chart will be established and set up to be controlled by an External Control Application, such as Viz Trio or Viz Pilot. In an environment where the data will be modified directly through the plug-in, there will be no need for the shared memory or script as outlined below.
-
Create a new scene and add an empty container. This container will be used as a parent container. Rename the container to object.
-
Add the Bar Chart plug-in to a sub-container in the scene tree and name it BarChart, then open the plug-in properties.
-
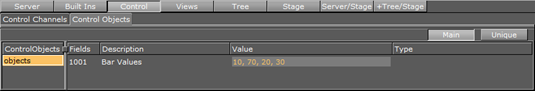
In the Data field, add a series of comma-separated values. Here, the values 10, 70, 20, 30 are used.
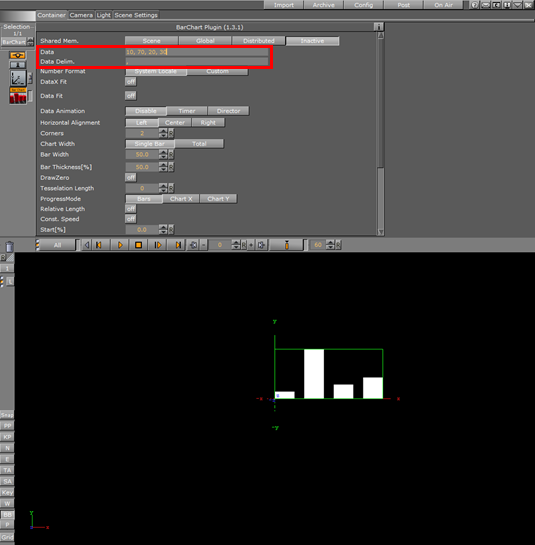
Note: By using the Data Delim. field, the data delimiter can be changed from comma to any other delimiter, for example the pipe character |, to suit the needs of the production environment the scene will be used in.
-
Currently, the Shared Mem. parameter is set to Inactive. This means that the data used by the plug-in is being read from the Data field, as set in step 2. However, in most cases some sort of shared memory would be used in order to share the same data with other plug-ins, in particular the Data Label plug-in that will be introduced in a later step.
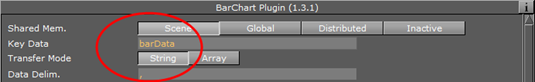
In this example, the Scene shared memory will be used. This Shared Memory setting does not interfere with any other scene(s) or machine, only the local scene. By clicking the Scene button, the field Key Data becomes available, where the name of the shared memory used for the bar data must be specified. An external control application, such as Viz Pilot or Viz Trio, can now be used to set the values that are to be represented by the bar chart. Enter barData as the shared memory name.
-
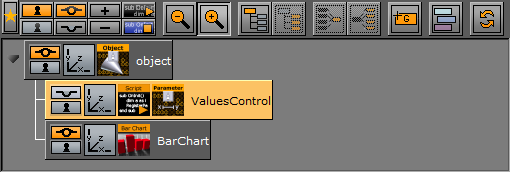
Add an empty container to the scene tree, and then the Control Parameter and Script container plug-ins to the newly created container. Rename the container to ValuesControl and open the Script plug-in properties.
Adding a Script to Control Data
-
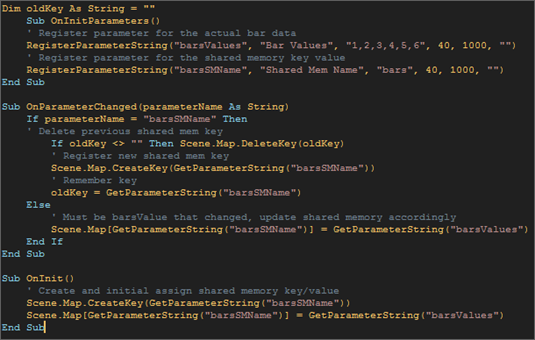
Next, a script allowing the data to be controlled with the Control Parameter plug-in needs to be added:
Dim oldKey As String =""Sub OnInitParameters()RegisterParameterString("barsValues","Bar Values","1,2,3,4,5,6",40,1000,"")RegisterParameterString("barsSMName","Shared Mem Name","barData",40,1000,"")End SubSub OnParameterChanged(parameterName As String)If parameterName ="barsSMName"ThenIf oldKey <>""Then Scene.Map.DeleteKey(oldKey)Scene.Map.CreateKey(GetParameterString("barsSMName"))oldKey = GetParameterString("barsSMName")ElseScene.Map[GetParameterString("barsSMName")] = GetParameterString("barsValues")End IfEnd SubSub OnInit()Scene.Map.CreateKey(GetParameterString("barsSMName"))Scene.Map[GetParameterString("barsSMName")] = GetParameterString("barsValues")End SubTip: As alternative to a string with a data delimiter, the data source could also be a Double-Array. This can be achieved by selecting Array as Transfer Mode in the Data Bar plug-in properties. In that case, instead of assigning a string, an Array[Double] data type would have been assigned in the example script above. This can be convenient if the data is provided by an external source, for instance a database or as the result of parsing a text file.
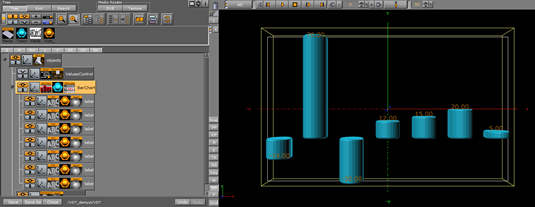
After entering the above script into the script editor, click the Compile & Run button. The scene tree should now look like this:
-
Open the Control Parameter plug-in properties. Change the Field Identifier to 1001, set the Data Type to Text, and enter SCRIPT*INSTANCE*barsValues in the Parameter field. By opening the Control Objects tab in the Control area, the Bar Values can now be changed directly. Any changes here should be reflected immediately on the rendered output in the Preview window when pressing Enter.
-
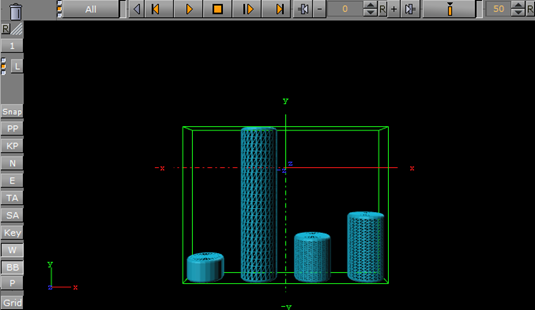
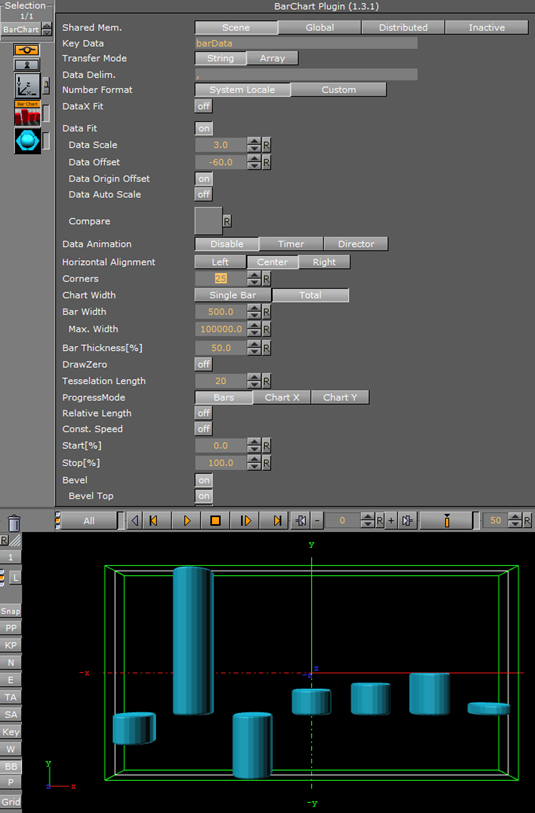
Apply a material on the BarChart container. The shape of the rendered bars can be controlled by adjusting the Corners, Tesselation Length, and Bevel parameters in the Bar Chart plug-in properties. For a classic 2-dimensional bar, a Corners value of 2 will suffice. For a smooth cylinder shape, the corners value can be increased up to a maximum of 1000. Activate Wireframe rendering mode in the preview window by clicking the W button in the scene editor to get a better understanding of these parameters. This is how it may look with Corners set to 25, a Tesselation Length of 20, with Bevel, Bevel Top and Bevel Bottom set to On, Bevel size (%) to 15 and Bevel Steps to 10:
-
Drag a Rectangle container plug-in to the scene tree to create a new container, and add the Expert container plug-in. In the Expert plug-in properties, select Outline as Drawmode to create a bounding box.
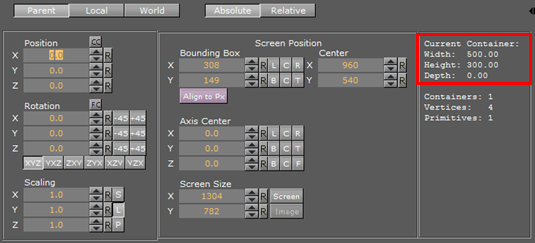
Often, it is useful to fit the entire data into a given screen bounding box. This can be achieved positioning the newly added rectangle on the screen, representing the area where the graph should be drawn. Here, the rectangle has width of 500 and a height of 300. It is positioned at 0.0 in Z-space, as is also the container holding the Bar Chart itself.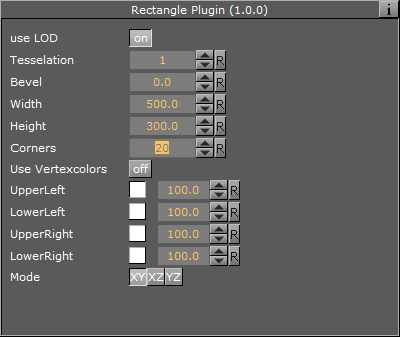
Open the rectangle container’s Transformation Editor and check the effective width and height of the boundary rectangle:
-
To match the width of the graph to the bounding box, open the Bar Chart plug-in properties and change the Chart Width to Total and the Bar Width to that of the bounding rectangle (500.0). Then set Horizontal Alignment to Center.
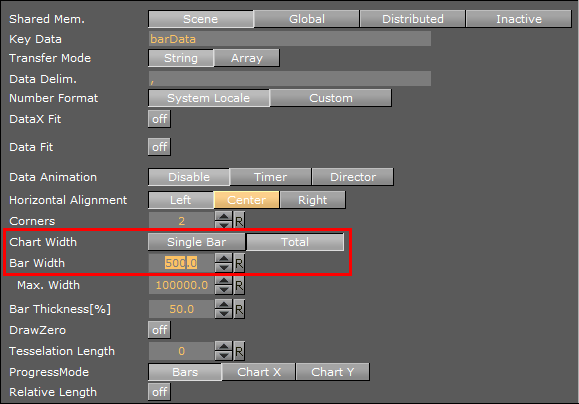
Tip: The Max. Width parameter defines how thick a bar can become. If the number of input values are reduced, the bars width will increase within the defined Bar Width area. If there are only two bars left, they will look really big. The Max. Width parameter is useful to limit the impact of this behavior.
-
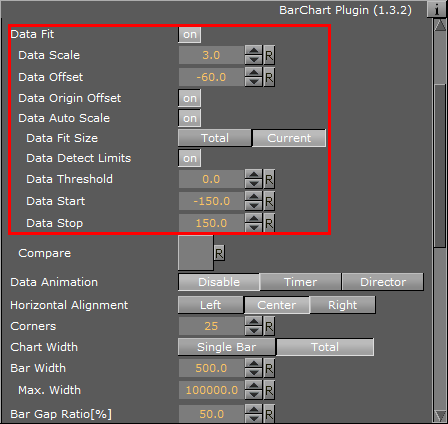
Mapping the graph to fit the whole height of the bounding area is done by enabling some of the properties inherent of the Bar Chart plug-in. In the property panel, set Data Fit and Data Auto Scale to On, then set Data Fit Size to Current. Then either type in, or click and drag, the Data Start and Data Stop values as required. The sum of these two should equal the height of the bounding box.
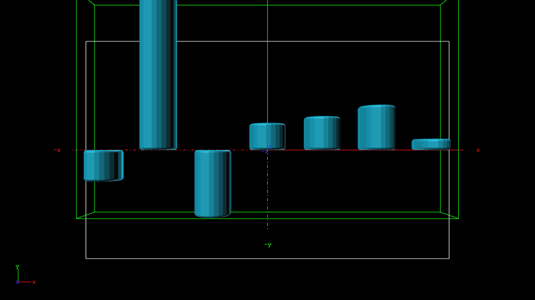
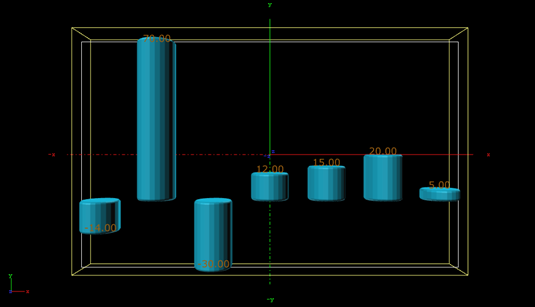
Open the Control Object tab in the Object area, and enter the values used for the example data scale calculation above, -14, 70, -30, 12, 15, 20, 5, as values for the Bar Values object. The preview is automatically updated. The result should look like this, with the Bars perfectly matching the bounding area:
Please go to straight to Adding Labels to the Bars to continue with the tutorial. The following section is intended as reference for users wanting to perform this scaling manually, or by an external application or a script.
Calculating Scale Manually, for External Applications, or for Scripts
The minimum and maximum values of the data needs to be known to be able to calculate the required scale value. For example, if using the values -14, 70, -30, 12, 15, 20, 5 as input data, the minimum value is -30 and the maximum value is 70. If negative values are not used, set the minimum value to minimum to 0.0 (more mathematically speaking; min=minimum(0.0, minimum(inputdata))). For the example values above, this results in a range of 100 (from min to max). These 100 units must be matched to the bounding box height, which is 300. Dividing 300 by 100 returns a scale value of 3.0.
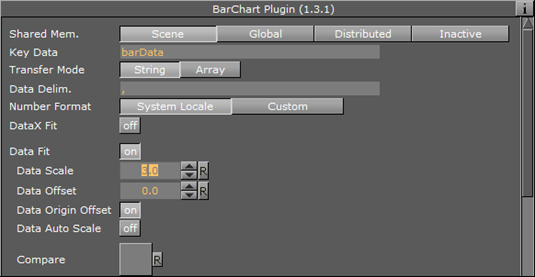
Set Data Fit to On and enter this value in the Data Scale field (1):
Open the Control Object tab in the Object area, and enter the values used for the example data scale calculation above, -14, 70, -30, 12, 15, 20, 5, as values for the Bar Values object. The preview is automatically updated. Notice how the graph aligns to the bounding box size, however, it is not centered in the middle.
To center the graph within the bounding box, a data offset translation value must be calculated. The formula for calculating this value is:
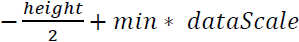
where dataScale is the value calculated in the previous step, and height is the bounding height (here: 300). Using the values in this example, the formula would be
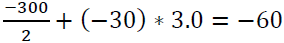
Set Data Origin Offset to On and enter the resulting value, -60, in the Data Offset field. The result should look like in step 11, with the bars perfectly matching the bounding area.
Adding Labels to the Bars
In order to have labels representing the bar value above each bar, the Data Label container plug-in is used.
-
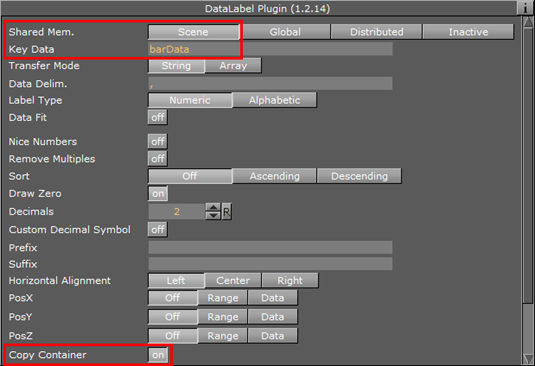
Add the Data Label plug-in to the BarChart container and open the plug-in properties. Select Scene as Shared Mem. and enter barData in the Key Data field, then set the Copy Container parameter to On.
-
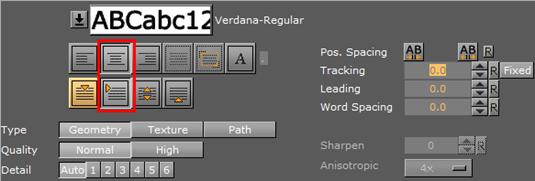
Create a new container as a child of the BarChart container, and add a font and a material to the new container. Rename the container to label. Set the size and text parameters as desired. Here, the font container’s Scaling is .25, and the font orientations are set to Orientation center and Vertical orientation first line.
-
Open the Bar Chart plug-in properties and set Pos. Container to On. Combined with the Copy Container parameter set in step 13, the parameter Pos Container will let Viz copy the label container for each label value and position the sub-containers of the BarChart container in relation to the respective bar representing the value. Container offsets can also be defined if desired.
Tip: When creating 3D bars where the Corner value is set to more than 2, the label needs to be offset in Z-space. A way to circumvent this is to add the Expert container plug-in, and setting Z-Buffer Ignore to On.
-
Open the Control Area and change one of the bar values in the Control Object tab, in order to trigger a refresh. This should create the new label containers and populate them with data. If modifications are required on the label prototype (the first child container), delete all other siblings and alter one or more of the data input values, in order to trigger a new refresh and thus a re-creation of the sibling containers.
Animating the Bars
Basic animation of the bars is typically controlled by the Bar Chart’s Stop% parameter, with values from 0.0 to 100.0. For a basic animation, set Stop% to 0 and add a key-frame at frame 0, then set the Stop% value to 100 and add another key-frame.
There are various other parameters that further influence the animation:
-
By activating the Const. Speed setting, animation of each bar will have the same duration.
-
The Relative Length setting gives each bar its own 100 percent length, meaning 7 bars equal 700 percent.
-
When Progress Mode is set to Bars, each bar subsequently grows to its value; and when set to ChartX or Y, the whole chart grows horizontally or vertically, respectively, with the incoming bars already at their final height.
Note: When Progress Mode is set to Chart Y, columns representing negative values will not be visible.
Animating the Labels
The labels can be animated in a similar fashion, as the Data Label plug-in have the same Stop%, Relative Length and Const. Speed parameters. Additionally, the values can be animated while the bars grow by setting Animate Values to On. By adding an Alpha plug-in to the label containers, and activating the setting Use Alpha, the labels will fade in as the bars appear.
The parameter Use Scale is used when an interpolation on the scale value of each label between 0.0 and 1.0 is required. As a result of the fact that the scaling interpolates to the fixed value of 1.0, combined with the fact that the font label in most cases is somehow scaled, fonts often appear too big. This problem can be overcome by adding a parent container to the font. The Data Label plug-in will put the text into the first child container containing a Text Geometry plug-in, so the label content is preserved.
Adding Color
Colors can be assigned to each individual bar, by setting the Map parameter of the Bar Chart plug-in to Color. RGB and alpha values can be set by adjusting the Color ID. However, Viz Trio and Viz Pilot will not be able to control the colors, there is no control plug-in capable to do so. This can be resolved by using a script and to expose the script parameters to the control application. The following script example allows to set a clear color for all bars, and it has a button that calculates the min/max bar and assigns different colors to those bars:
Sub calcMinMax()Dim chart As Container = GetParameterContainer("bars")If chart = null Then Exit SubDim valueString As String = Scene.map[GetParameterString("barsSMName")]Dim values as Array[String]Dim minValue As Double = 1000000Dim maxValue As Double = -100000Dim minIndex As Integer = -1Dim maxIndex As Integer = -1Dim i As Integer = 0valueString.split(",", values) For Each str In valuesIf str.length <> 0 ThenIf CDbl(str) < minValue ThenminValue = CDbl(str)minIndex = iEnd If If CDbl(str) > maxValue ThenmaxValue = CDbl(str)maxIndex = iEnd IfEnd Ifi = i + 1NextDim col As ColorDim clearColor As Color = GetParameterColor("clearColor") For i = 0 To values.SizeIf i = maxIndex Thencol.Red = 0.317col.Green = 0.71col.Blue = 0.0ElseIf i = minIndex Thencol.Red = 1.0col.Green = 0.14col.Blue = 0.0Elsecol = clearColorEnd If chart.Geometry.SetParameterInt("ColorID", i)chart.Geometry.SetParameterColor("Color", col)NextEnd Sub Sub resetColors() Dim chart As Container = GetParameterContainer("bars") If chart = null Then Exit Sub Dim valueString As String = Scene.map[GetParameterString("barsSMName")]Dim values as Array[String] Dim i As Integer = 0valueString.split(",", values) Dim col As Color = GetParameterColor("clearColor") For i = 0 To values.Sizechart.Geometry.SetParameterInt("ColorID", i)chart.Geometry.SetParameterColor("Color", col)NextEnd Sub Sub OnExecAction(buttonId As Integer)If buttonId = 0 Then calcMinMax()If buttonId = 1 Then resetColors()End Sub Sub OnInitParameters()RegisterParameterContainer("bars", "Bar Chart")RegisterParameterString("barsSMName", "Shared Mem Name", "bars", 40, 1000, "")RegisterPushButton("minmax", "Calc Min/Max", 0) Dim clearColor As Color clearColor.Red = 1clearColor.Green = 1clearColor.Blue = 1 RegisterParameterColor("clearColor", "Clear Color", clearColor)RegisterPushButton("reset", "Reset Colors", 1)End Sub Sub OnInit()resetColors()End SubThe ControlParameter is set to Text, and the parameter to control is SCRIPT*INSTANCE*clearColor.
See Also