Viz Artist
Version 3.10 | Published May 03, 2018 ©
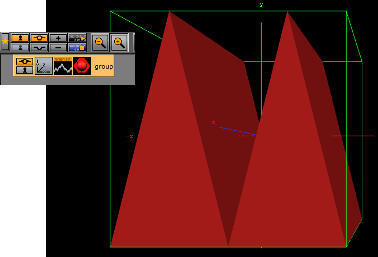
Graph2D
![]()
Use this plug-in to create 2D and 3D graphs, lines and bars from imported files.
Note: This plug-in is located in: Built Ins -> Geom plug-ins -> Default
This section contains the following topics:
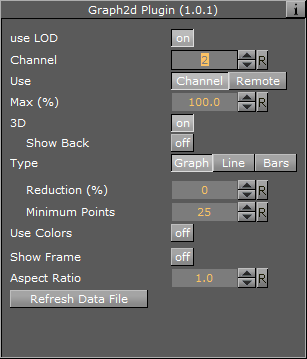
Graph2D Properties
-
use LOD: LOD stands for Level of Detail. In depending of the camera <-> object distance a high or lower detailed object will be rendered with marginal quality casualties if this toggle is switched on
-
Channel: Affects the Channel File to search for. The file holds the vertex and other data to define the whole graph
-
Use: Load the file through a Channel File or remote access
-
Max (%): It sets the rage for rendering. For example, if the range is set to 50% the graph will be cut 50% in width
-
3D: Enable 3D rendering of the graph, and the Show Back option.
-
Show Back: Enable the object to show the back in case the object will be rotated
-
-
Type: Following types are available: Graph, Line and Bars. Take a change if you want another visual depiction. Graph enables the Reduction and Minimum Points settings. Line enables the Constant Width, Line Width (%), Reduction (%) and Minimum Points settings. Bars enables the Bars Width (%) and Bar Animation settings
-
Reduction (%): The points will be reduced by the Douglas-Peucker algorithm. The Douglas-Peucker algorithm is an algorithm for reducing the number of points in a curve that is approximated by a series of points
-
Minimum Points: Changes the number of points for rendering the graph
-
Constant Width: Sets a constant width
-
Line Width (%): It changes the width of the line
-
Reduction (%): The points will be reduced by the Douglas-Peucker algorithm. The Douglas-Peucker algorithm is an algorithm for reducing the number of points in a curve that is approximated by a series of points
-
Minimum Points: It changes the number of points for rendering the graph
-
Bar Width (%): It changes the width of all bars
-
Bar Animation: One by One: Each bar will be separately rendered. All together: All bars will be rendered at the same time
-
-
Use Colors: Sets the color for positive and negative values. This setting is only available for graphs and bars (not line)
-
Show Frame: Shows the frame around the graph. Useful for orientation
-
Aspect Ratio: Stretch the graph evenly in x-direction
-
Refresh Data File: Reload the Channel File, which holds the data value for the x- and y-points
To Create a Channel File for a Graph2D
-
Create a text file (for example, CHANNEL2), with no file extension.
-
Add this data: 5 0 0 10 20 20 0 30 20 40 0.
-
The first number (5) holds the number of points available in the file.
-
The other definitions are the X and Y points -> (0/0), (10/20), (20/0) etc.
-
-
Create this directory: <viz data folder>\plug-in\graph2D. and place the channel file in it.
IMPORTANT! The channel file must always be named CHANNEL<Channel number>.
To Create a 2D Graph
-
Create a new Container.
-
Add the Graph2D plug-in.
-
Add a Material and/or a Texture.
-
Set the Channel parameter to the Channel file (for example: 2 for CHANNEL2).
-
Click Refresh data file if the Channel file contents have been modified.