
Viz Artist
Version 3.10 | Published May 03, 2018 ©
Data Label
![]()
This plug-in enables graph labeling for all Financial plug-ins. All containers beneath the current container get labeled with the values from your Shared Memory variables.
Note: This plug-in is located in: Built Ins -> Container plug-ins -> VisualDataTools
This section contains information on the following topics:
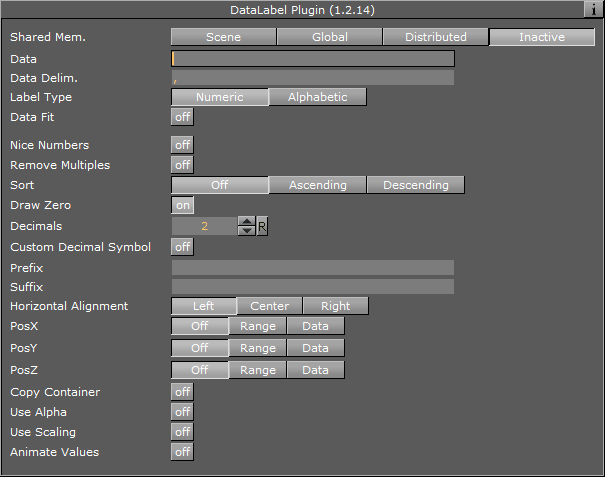
Data Label Properties
-
Shared Mem.: Changes between Scene-, Global- and Distributed-Shared Memory. Use Inactive memory to not forward any values via Shared Memory.
-
Key Data: Shared Mem. key name
-
Data: Input Parameter for data
-
Transfer Mode: Sets string- or array-based data transfer.
-
Data Delim.: Defines the value separator sign(s)
-
Label Type: Sets the label type to numeric values (default) or alphabetic labels (to show weekdays, months, etc.).
-
Data Fit: Enables data normalization.
-
Data Threshold: Adds a definable offset to the detected limit.
-
-
Data Scale: Scales input by the selected factor
-
Data Offset: Adds an offset to the incoming data
-
Data Auto Scale: Enables automatic data normalization
-
Data Detect Limits: Detects minimum and maximum of all values and scales them to adjusted Start and Stop.
-
Data Start: Lower Auto Scale edge
-
Data Stop: Upper Auto Scale edge
-
Nice Numbers: Rounds to the best fitting next number.
-
Remove Multiples: Removes multiple values.
-
Sort: Sorts your data items ascending or descending.
-
Draw Zero: Show or hide 0 values.
-
Decimals: Adjust decimal digits of all your labels.
-
Custom Decimal Symbol: Enables you to set a custom decimal symbol.
-
Decimal Symbol: Specifies the decimal symbol.
-
-
Prefix: Adds a label prefix.
-
Unit: Define a custom unit for your dat values.
-
PosX, Y, Z: Positions container along the adjusted distance or uses numeric data value input to translate the label containers.
-
OffsetX, Y, Z: Translates the label container on the current axis.
-
DistanceX, Y, Z: Sets whole positioning distance for the containers on the current axis.
-
Copy Container: If there are less containers than values, then new containers will be added.
-
Use Alpha: Use input data for alpha scaling.
-
Use Scaling: Use input data for alpha scaling.
-
Animate Values: Let the current number run from 0 to the defined end value.
-
Relative Length: If activated, each label will have it’s own 100% (e.g. 7 labels equal 700%).
-
Const. Speed: Sets the same animation duration for each label.
-
Total Length%: Sets the accumulated value of all labels in percent.
-
Alpha max.: Limits maximum alpha value.
-
Copy Container: Limits maximum scaling value
To Create a Scene with Data Label
-
Add an empty container to the scene.
-
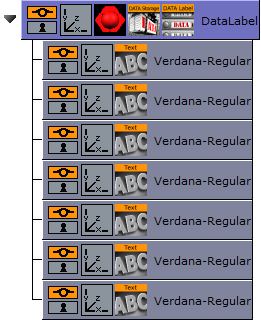
Start with an empty scene and drag and drop a DataLabel and a DataStorage plug-in on a container in the scene-tree.
-
Add a Text child container
-
Go to the DataLabel plug-in, set Shared Mem. to Scene and KeyData to “MyData”.
-
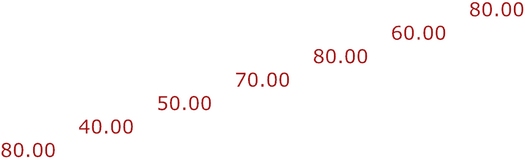
In DataStorage also set Shared Mem. to Scene, Key Data1 to “MyData” and Data1 to e.g.: 80,40,50,70,80,60,80
-
Go back to the DataLabel plug-in and activate Copy Container to create multiple instances of the text containers automatically.
-
You see all labels located on the same position now. In the previous examples always the chart plug-in was responsible for the label positioning. In this example we want to move that responsibility to the DataLabel plug-in itself.
-
-
Switch PosX to Range, DistanceX to 500.0 and OffsetX to -250.0.
-
We want to position the labels over a certain X, Y or Z range in space.
-
-
Set PosY to Range, OffsetY to -75.0 and DistanceY to 150.0
-
You can also do a value dependent translation by setting PosX, Y, or Z to Data
-
Set Sort to Ascending to sort the labels.
-
You see that there are labels with the same values. We want to get rid of them and activate Remove Multiples for that. You can also try the Nice Numbers option now which searches for the next logarithmic style labels. But we continue with deactivated Nice Numbers parameter now.
-
-
Activate Animate Values and turn down Total Length[%] to 0.0. Create a Key Frame, set Total Length[%] back to 100.0 and create another Key Frame.
-
This will create an animation where the label values should count up to their final value.
-
Start the animation and see the labels counting and distributing over the specified XY range.
-