
Viz Artist
Version 3.10 | Published May 03, 2018 ©
Control Chart
![]()
The Control Chart plug-in binds control of chart data to a Control Object. It currently supports the graph geometry plug-in and the bar values, pie values and Visual Data Tools plug-ins. It serves the purpose to interface all kind of chart data. It covers graph charts, bar charts, pie charts, area charts and generally all kind of plug-in data, which has a table-like representation.
Control chart offers the same kind of interface like control list. That means it delivers a schema specification as type encoding. The chart data is communicated as an XML table value fully compatible to control list values. The supported control chart commands mimic the control list commands.
Note: This plug-in is located in: Built Ins -> Container plug-ins -> Control
This section contains information on the following topics:
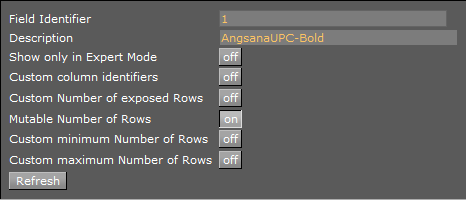
Control Chart Properties
-
Custom Number of Exposed Rows: Enables the Number of exposed Rows setting.
-
Number of exposed rows: Sets the default number of exposed rows for the scene when the number of rows can be changed by the operator. If the number of rows cannot be changed the number of exposed rows is fixed.
-
-
Mutable Number of Rows: If set to on, the operator can add or delete rows.
-
Custom minimum and maximum Number of Rows: Enables the Minimum and Maximum Number of Rows settings. To the operator, the number of fields can only be added or deleted when inside the range (for example greater than > 2 and less than < 10).
-
IMPORTANT! If Control Chart is used in combination with Visual Data Tools plug-ins, make sure the Visual Data Tools plug-in Shared Memory is set to Inactive.
See Also