
Viz Artist
Version 3.10 | Published May 03, 2018 ©
Scatter Chart
![]()
This plug-in draws a scatter chart, filled with data out of a Shared Memory Map. You can use delimited strings or arrays for data transfer via Scene-, Global- or Distributed-Shared Memory.
Note: This plug-in is located in: Built Ins -> Geom plug-ins -> VisualDataTools
This section contains the following topics:
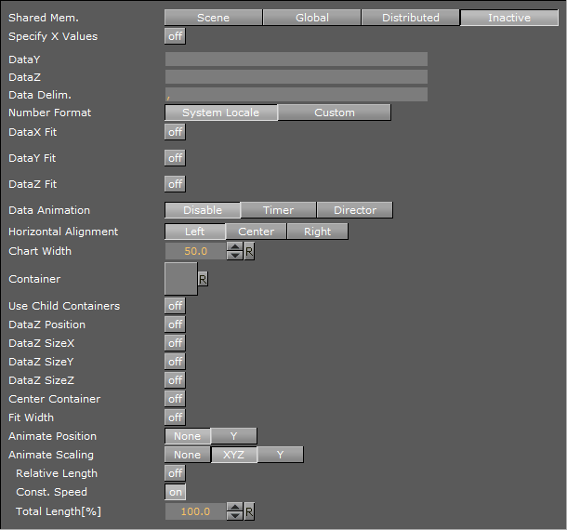
Scatter Chart Properties
-
Shared Mem.: Changes between Scene-, Global- and Distributed-Shared Memory. Use Inactive memory to not forward any values via Shared Memory
-
Key DataX: Shared Mem. key name for X values. DataX is the default input parameter for X values
-
Key DataY: Shared Mem. key name for Y values. DataY is the default input parameter for Y values
-
Key DataZ: Shared Mem. key name for Z values. DataZ is the default input parameter for Z values
-
Transfer Mode: Sets string- or array-based data transfer
-
Data Delim.: Defines the value separator sign(s)
-
Number Format: Defines if Viz should get the decimal point separator from the System Locale or Custom settings. If Custom is enabled,
-
Decimal Symbol: Defines which symbol is used as decimal point when Custom Number Format is set.
-
-
DataX, -Y, -Z Fit: Enables data normalization
-
DataX, -Y, -Z Scale: Scales input by the selected factor
-
DataX, -Y, -Z Offset: Adds an offset to the incoming data
-
DataX, -Y, -Z Auto Scale: Enables automatic data normalization
-
DataX, -Y, -Z Detect Limits: Detects minimum and maximum of all values and scales them to adjusted Start and Stop
-
DataX, -Y, -Z Threshold: Adds a definable offset to the detected limit
-
DataX, -Y, -Z Start: Lower Auto Scale edge
-
DataX, -Y, -Z Stop: Upper Auto Scale edge
-
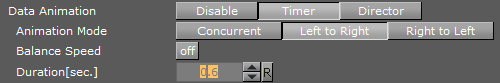
Data Animation: Set the animation type to be created when data change is detected:
-
Disable: No animation
-
Timer: Create data transition animation (from an old set of data to a new set) within the specified time set in Duration sec.. Also select an Animation Mode
-
Director: Create data transition animation with the Stage Director, that controls the Animation Progress parameter from 0.0% (old data) to 100.0% (new data). Also select an Animation Mode
-
-
Animation Mode:
-
Concurrent: All nodes change concurrently
-
Left to Right: Transition from left to right
-
Right to Left: Transition from right to left
-
-
Balance Speed: Set to On, when Animation Mode is set to Left to Right or Right to Left, and the position of transformed data will be related to node values as well
Example:Balance Speed: If the values of four nodes change from 0,0,0,0 to 1,9,90,900 in Left to Right mode at 50% of the transformation. Balance Speed Off: Only the first two nodes will be transformed to new values. Balance Speed On: The first three nodes are already transformed to new values, and the last node also transformed to 44% of the new values, because the data change from 0 (0+0+0+0) to 1000 (1+9+90+900), at 50% of transformation (in this case the values is changed for 500 of 1000), the first 3 nodes are already finished and the last node is changed to 400
-
Durationsec.: Set the duration of the animation in seconds for Timer mode
-
Horizontal Alignment: Sets horizontal orientation to left, center or right
-
Chart Width: Adjusts the chart width
-
Container: Drag drop the container which will be used for the scatter nodes
-
DataZ Position: Use DataZ for Z-axis positioning
-
DataZ SizeX: Z Values influence X scaling
-
DataZ SizeY: Z Values influence Y scaling
-
DataZ SizeZ: Z Values influence Z scaling
-
Center Container: Centers each translated container
-
Fit Width: Considers the width of the scatter node containers which means that the containers do not reach outside of the specified range
-
Animate Position: Sets the translation type: None: no animation, Y: animates the container along the Y axis (suggestion: Scale Y + DataLabel for BarChart alike labeling)
-
Animate Scaling: Sets the scaling type: None: no scaling at all, XYZ: linear scaling in all directions, Y: scales in y direction only (->BarChart)
-
Relative Length: If activated, each scatter node will have its own 100% size (e.g. 7 nodes equal 700%)
-
Const. Speed: Sets the same animation duration for each bar
-
Total Length%: Sets the accumulated size of all scatter nodes in percent
-
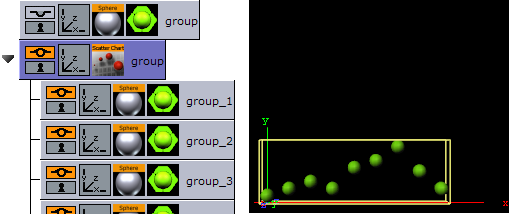
To Create a Scatter Chart
-
Create a group and add the Sphere plug-in to it.
-
Open the transformation editor and set the Scaling (locked) to 0.2.
-
Add a material and/or a texture to the sphere.
-
Set the group with the sphere to hidden.
-
Create a new group and add the Scatter Chart plug-in to it.
-
Open the Transformation Editor and set Position X and Y to -100.0.
-
Open the Scatter Chart editor and set the following parameters:
-
Set the following DataY values: 10,20,30,20,50,60,80,45,20.
-
Set Width to 250.0.
-
Drag and drop the container with the Sphere to the Container placeholder.
-
See Also